На метеорологических станциях скорость ветра обычно измеряют при помощи флюгера с ветромерной доской. Когда ветра нет, доска висит вертикально. Чем сильнее ветер, тем на больший угол отклоняется доска.
По штифтам расположенного около доски указателя можно определить скорость ветра.
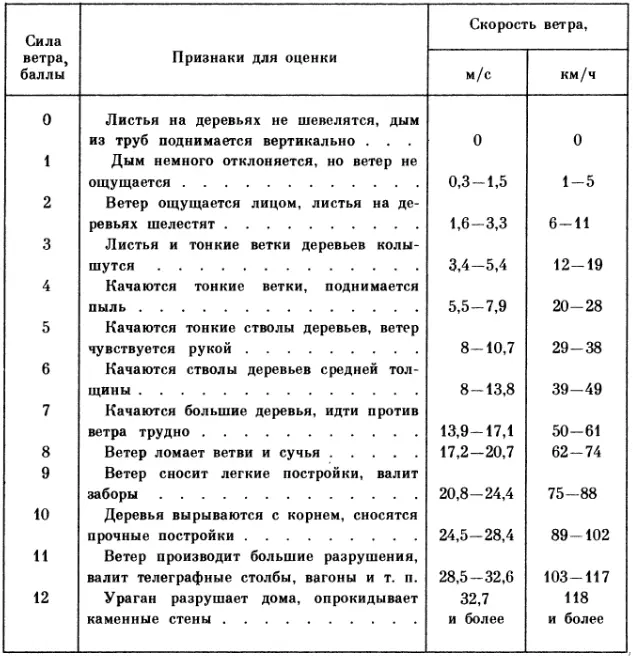
Ниже приводится таблица сравнительной оценки силы ветра (в баллах), соответствующей определенной скорости (в метрах в секунду и в километрах в час). Рисунок 13 иллюстрирует действие ветра разной силы (а баллах).
Более точно среднюю скорость ветра можно определять при помощи анемометра (рис. 14). Прибор состоит из вращающейся крыльчатки, ось которой при вращении приводит в действие зубчатый механизм, подсчитывающий число оборотов крыльчатки за определенное время. Зная число оборотов крыльчатки, можно рассчитать скорость ветра. При помощи анемометра можно изучать распределение ветров по высоте.
Полученные на метеорологической станции результаты наблюдения за ветром имеют большое научное значение прежде всего для самой метеорологии – науки о погоде и климате, а также для авиации, артиллерии и даже для космических полетов.

Условие
B9. Скорость велосипедиста 36 км/ч, а скорость встречного ветра 4 м/с. Какова скорость ветра в системе отсчета, связанной с велосипедистом?
Решение
1 способ. Решим задачу по предложенному плану.
| План решения задач: | Решение |
|---|---|
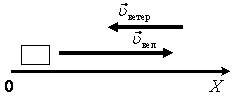
| 1. Сделайте чертеж: тела изобразите в виде прямоугольников, над ними укажите направление скорости. |
Рис. 1 |
| 2. Выберите направление осей координат. | |
| 3. Исходя из условия задачи или по ходу решения: | |
| а) определите тело, скорость которого надо найти; | Ветер. |
| б) определите тело, с которым свяжем неподвижную СО; | Земля. |
| в) определите тело, с которым свяжем подвижную СО и объясните свой выбор; | Велосипедист, т.к. несмотря на то, что движутся два тела (велосипедист и ветер), нужно определить скорость ветра относительно велосипедиста. |
| г) найдите скорость системы и объясните свой выбор; | υc = υвел = 36 км/ч = 10 м/с, т.к. это скорость тела, с которым мы связали подвижную систему. |
| д) найдите скорость тела относительно неподвижной СО и объясните свой выбор; | υton = υветер = 4 м/с, т.к. скорость ветра задана относительно земли (нет специальных оговорок), с которой мы связали неподвижную систему. |
| е) найдите скорость тела относительно подвижной СО и объясните свой выбор. | Это скорость ветра относительно велосипедиста, с которым мы связали подвижную систему. По условию эту скорость нужно найти. |
| 4. Запишите закон сложения скоростей в векторном виде. | (~vec upsilon_{ton} = vec upsilon_c + vec upsilon_{top}) |
| 5. Найдите искомые величины. |
Способ а. Найдем проекцию скоростей на ось 0X:
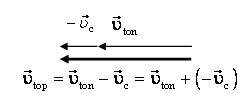
—υton = υc + υtopx(рис. 1), вектор скорости (~vec upsilon_{ton}) направлен против оси. После преобразований получим υtop x = –υton – υc = –υветер – υвел. Тогда υtopx = –4 м/с – 10 м/с = –14 м/с. Знак «–» указывает, что проекция скорости отрицательная, т.е. вектор (~vec upsilon_{top}) направлен против выбранной оси 0Х. Способ б. Найдем векторную сумму скоростей. Из рисунка 2 видно, что значение υton = υc + υtop = υветер +υвел.
Рис. 2 Тогда υtop = 4 м/с + 10 м/с = 14 м/с. |
2 способ. Так как требуется найти скорость ветра в системе отсчета, связанной с велосипедистом, то воспользуемся законом сложения скоростей в следующем виде[~vec upsilon_{vet} = vec upsilon_{vel} + vec upsilon_{vet/vel}] , где υvet = 4 м/с – скорость ветра, по умолчанию, относительно земли (неподвижной СО); υvel = 36 км/ч = 10 м/с – скорость велосипедиста, по умолчанию, относительно земли (неподвижной СО); υvet/vel – скорость ветра в системе отсчета, связанной с велосипедистом, по условию эту скорость нужно найти. Тогда (~vec upsilon_{vet/vel} = vec upsilon_{vet} — vec upsilon_{vel}) или в проекции на ось 0Х:
υvet/vel x = –υvet – υvel; υvet/vel x = –4 м/с – 10 м/с = –14 м/с. Знак «–» указывает, что проекция скорости отрицательная, т.е. вектор направлен против выбранной оси 0Х.
Для удобства вычислений выразим ско-
рость велосипедиста в тех же единицах, что и ско-
рость ветра:
![]()
Скорость ветра в системе отсчета, связанной с велоси-
педистом, равна векторной разности скоростей ветра
и велосипедиста в системе отсчета, связанной с зем-
лей. Поэтому при встречном ветре искомая величина
(модуль скорости ветра в движущейся системе отсче-
та) равна сумме модулей заданных скоростей ветра и
велосипедиста:
4 м/с + 10 м/с = 14 м/с.
При попутном ветре она равна модулю разности этих
скоростей:
10 м/с — 4 м/с = 6 м/с.
Ответ: 14 м/с, 6 м/с.
From Wikipedia, the free encyclopedia
Not to be confused with Airspeed.

An anemometer is commonly used to measure wind speed.

Global distribution of wind speed at 10m above ground averaged over the years 1981-2010 from the CHELSA-BIOCLIM+ data set[1]
In meteorology, wind speed, or wind flow speed, is a fundamental atmospheric quantity caused by air moving from high to low pressure, usually due to changes in temperature. Wind speed is now commonly measured with an anemometer.
Wind speed affects weather forecasting, aviation and maritime operations, construction projects, growth and metabolism rate of many plant species, and has countless other implications.[2] Wind direction is usually almost parallel to isobars (and not perpendicular, as one might expect), due to Earth’s rotation.
Units[edit]
Metres per second (m/s) is the SI unit for velocity and the unit recommended by the World Meteorological Organization for reporting wind speeds, and is amongst others used in weather forecasts in the Nordic countries.[3] Since 2010 the International Civil Aviation Organization (ICAO) also recommends meters per second for reporting wind speed when approaching runways, replacing their former recommendation of using kilometres per hour (km/h).[4]
For historical reasons, other units such as miles per hour (mph), knots (kn)[5] or feet per second (ft/s) are also sometimes used to measure wind speeds. Historically, wind speeds have also been classified using the Beaufort scale, which is based on visual observations of specifically defined wind effects at sea or on land.
Factors affecting wind speed[edit]
Wind speed is affected by a number of factors and situations, operating on varying scales (from micro to macro scales). These include the pressure gradient, Rossby waves and jet streams, and local weather conditions. There are also links to be found between wind speed and wind direction, notably with the pressure gradient and terrain conditions.
Pressure gradient is a term to describe the difference in air pressure between two points in the atmosphere or on the surface of the Earth. It is vital to wind speed, because the greater the difference in pressure, the faster the wind flows (from the high to low pressure) to balance out the variation. The pressure gradient, when combined with the Coriolis effect and friction, also influences wind direction.
Rossby waves are strong winds in the upper troposphere. These operate on a global scale and move from West to East (hence being known as Westerlies). The Rossby waves are themselves a different wind speed from what we experience in the lower troposphere.
Local weather conditions play a key role in influencing wind speed, as the formation of hurricanes, monsoons and cyclones as freak weather conditions can drastically affect the flow velocity of the wind.[citation needed]
Highest speed[edit]

The original anemometer that measured The Big Wind in 1934 at Mount Washington Observatory
The fastest wind speed not related to tornadoes ever recorded was during the passage of Tropical Cyclone Olivia on 10 April 1996: an automatic weather station on Barrow Island, Australia, registered a maximum wind gust of 113.3 m/s (408 km/h; 253 mph; 220.2 kn; 372 ft/s)[6][7] The wind gust was evaluated by the WMO Evaluation Panel who found that the anemometer was mechanically sound and the gust was within statistical probability and ratified the measurement in 2010. The anemometer was mounted 10 m above ground level (and thus 64 m above sea level). During the cyclone, several extreme gusts of greater than 83 m/s (300 km/h; 190 mph; 161 kn; 270 ft/s) were recorded, with a maximum 5-minute mean speed of 49 m/s (180 km/h; 110 mph; 95 kn; 160 ft/s) the extreme gust factor was in the order of 2.27–2.75 times the mean wind speed. The pattern and scales of the gusts suggest that a mesovortex was embedded in the already strong eyewall of the cyclone.[6]
Currently, the second-highest surface wind speed ever officially recorded is 103.266 m/s (371.76 km/h; 231.00 mph; 200.733 kn; 338.80 ft/s) at the Mount Washington (New Hampshire) Observatory 1,917 m (6,288 ft) above sea level in the US on 12 April 1934, using a hot-wire anemometer. The anemometer, specifically designed for use on Mount Washington was later tested by the US National Weather Bureau and confirmed to be accurate.[8]
Wind speeds within certain atmospheric phenomena (such as tornadoes) may greatly exceed these values but have never been accurately measured. Directly measuring these tornadic winds is rarely done as the violent wind would destroy the instruments. A method of estimating speed is to use Doppler on Wheels to sense the wind speeds remotely,[9] and, using this method, the figure of 135 m/s (490 km/h; 300 mph; 262 kn; 440 ft/s) during the 1999 Bridge Creek–Moore tornado in Oklahoma on 3 May 1999 is often quoted as the highest-recorded surface wind speed,[10] although another figure of 142 m/s (510 km/h; 320 mph; 276 kn; 470 ft/s) has also been quoted for the same tornado.[11] Yet another number used by the Center for Severe Weather Research for that measurement is 135 ± 9 m/s (486 ± 32 km/h; 302 ± 20 mph; 262 ± 17 kn; 443 ± 30 ft/s).[12] However, speeds measured by Doppler radar are not considered official records.[11]
The fastest wind speed observed on an exoplanet was observed on HD 189733b by scientists at the University of Warwick in 2015, and was measured at 2,414 m/s (8,690 km/h; 4,692 kn). In a press release, the University announced that the methods used from measuring HD 189733b’s wind speeds could be used to measure wind speeds on Earth-like exoplanets.[13]
Measurement[edit]
Modern day anemometer used to capture wind speed.

FT742-DM acoustic resonance wind sensor, one of the instruments now used to measure wind speed at Mount Washington Observatory
An anemometer is one of the tools used to measure wind speed.[14] A device consisting of a vertical pillar and three or four concave cups, the anemometer captures the horizontal movement of air particles (wind speed).
Unlike traditional cup and vane anemometers, ultrasonic wind sensors have no moving parts and are therefore used to measure wind speed in applications that require maintenance-free performance, such as on the top of wind turbines. As the name suggests, ultrasonic wind sensors measure the wind speed using high-frequency sound. An ultrasonic anemometer has two or three pairs of sound transmitters and receivers. Stand it in the wind and each transmitter constantly beams high-frequency sound to its respective receiver. Electronic circuits inside measure the time it takes for the sound to make its journey from each transmitter to the corresponding receiver. Depending on how the wind blows, it will affect some of the sound beams more than the others, slowing it down or speeding it up very slightly. The circuits measure the difference in speeds of the beams and use that to calculate how fast the wind is blowing.[15]
Acoustic resonance wind sensors are a variant of the ultrasonic sensor. Instead of using time of flight measurement, acoustic resonance sensors use resonating acoustic waves within a small purpose-built cavity in order to perform their wind speed measurement. Built into the cavity is an array of ultrasonic transducers, which are used to create the separate standing-wave patterns at ultrasonic frequencies. As wind passes through the cavity, a change in the wave’s property occurs (phase shift). By measuring the amount of phase shift in the received signals by each transducer, and then by mathematically processing the data, the sensor is able to provide an accurate horizontal measurement of wind speed and direction.[16]
Another tool used to measure wind velocity includes a GPS combined with pitot tube.[citation needed] A fluid flow velocity tool, the Pitot tube is primarily used to determine the air velocity of an aircraft.
Design of structures[edit]

Anemometer on an outdoor stage set, to measure wind speed
Wind speed is a common factor in the design of structures and buildings around the world. It is often the governing factor in the required lateral strength of a structure’s design.
In the United States, the wind speed used in design is often referred to as a «3-second gust» which is the highest sustained gust over a 3-second period having a probability of being exceeded per year of 1 in 50 (ASCE 7-05, updated to ASCE 7-16).[17] This design wind speed is accepted by most building codes in the United States and often governs the lateral design of buildings and structures.
In Canada, reference wind pressures are used in design and are based on the «mean hourly» wind speed having a probability of being exceeded per year of 1 in 50. The reference wind pressure  is calculated using the following equation:
  where
where  is the air density and
  is wind speed.[18]
Historically, wind speeds have been reported with a variety of averaging times (such as fastest mile, 3-second gust, 1-minute and mean hourly) which designers may have to take into account. To convert wind speeds from one averaging time to another, the Durst Curve was developed which defines the relation between probable maximum wind speed averaged over t seconds, Vt, and mean wind speed over one hour V3600.[19]
See also[edit]
- American Society of Civil Engineers (promulgator of ASCE 7-05, current version is ASCE 7-16)
- Beaufort scale
- Fujita scale and Enhanced Fujita Scale
- International Building Code (promulgator of NBC 2005)
- ICAO recommendations – International System of Units
- Knot (unit)
- Prevailing wind
- Saffir–Simpson Hurricane Scale
- TORRO scale
- Wind direction
References[edit]
- ^ Brun, P., Zimmermann, N.E., Hari, C., Pellissier, L., Karger, D.N. (preprint): Global climate-related predictors at kilometre resolution for the past and future. Earth Syst. Sci. Data Discuss. https://doi.org/10.5194/essd-2022-212
- ^ Hogan, C. Michael (2010). «Abiotic factor». In Emily Monosson; C. Cleveland (eds.). Encyclopedia of Earth. Washington D.C.: National Council for Science and the Environment. Archived from the original on 2013-06-08.
- ^ Windspeed | Icelandic Meteorological office «The Icelandic Meteorological Office now uses the SI (Systeme Internationale d’Unites) measurement metres per second (m/s) […] other Nordic meteorological institutes have used this system for years with satisfactory results»
- ^ International Civil Aviation Organization – International Standards and Recommended Practices – Units of Measurement to be Used in Air and Ground Operations – Annex 5 to the Convention on International Civil Aviation
- ^ Measuring Wind Speed in Knots «The reason why sea winds are measured in knots at all has to do with maritime tradition»
- ^ a b «Documentation and verification of the world extreme wind gust record: 113.3 m s–1 on Barrow Island, Australia, during passage of tropical cyclone Olivia» (PDF). Australian Meteorological and Oceanographic Journal.
- ^ «World record wind gust». World Meteorological Association. 5 November 2015. Retrieved 12 February 2017.
- ^ «The story of the world record wind». Mount Washington Observatory. Retrieved 26 January 2010.
- ^ «Massive Okla. tornado had windspeed up to 200 mph». CBS News. 20 May 2013. Retrieved 17 May 2014.
- ^ «Historical Tornadoes». National Weather Service.
- ^ a b «Highest surface wind speed-Tropical Cyclone Olivia sets world record». World Record Academy. 26 January 2010. Retrieved 17 May 2014.
- ^ Wurman, Joshua (2007). «Doppler On Wheels». Center for Severe Weather Research. Archived from the original on 2011-07-19.
- ^ «5400mph winds discovered hurtling around planet outside solar system». warwick.ac.uk. Retrieved 2020-08-08.
- ^ Koen, Joshua. «Make and Use an Anemometer to measure Wind Speed». www.ciese.org. Retrieved 2018-04-18.
- ^ Chris Woodford. Ultrasonic anemometers. https://www.explainthatstuff.com/anemometers.html
- ^ Kapartis, Savvas (1999) «Anemometer employing standing wave normal to fluid flow and travelling wave normal to standing wave» U.S. Patent 5,877,416
- ^ «Wind and Structures». Korea Science (in Korean). Retrieved 2018-04-18.
- ^ NBC 2005 Structural Commentaries — Part 4 of Div. B, Comm. I
- ^ ASCE 7-05 commentary Figure C6-4, ASCE 7-10 C26.5-1
External links[edit]
 Media related to Wind speed at Wikimedia Commons
При всей простоте и грубости принятой в этой задаче модели в итоге получился довольно разумный ответ. У нас получилось значение, лежащее между обычной скоростью ветра у поверхности (например, прогноз погоды на завтра обещает ветер 4–5 м/с) и экстремальными скоростями 100–150 м/с, которые фиксировались в самых мощных торнадо. Также известно, что на высоте в несколько десятков километров — в стратосфере — дуют сильные ветры, называемые высотными струйными течениями. Характерная скорость ветра в них — 30 м/с. Получается, что на качественном уровне наша модель вполне удовлетворительно описывает трансформацию энергии в атмосфере.
Приведем несколько аргументов в пользу того, почему можно считать, что цикл работы атмосферы как теплового насоса составляет 1 сутки. Есть два периода, связанные с движением Земли: 1 сутки и 1 год, и вопрос в том, какие характерные временные масштабы у разных процессов в атмосфере.
При скорости V = 25 м/с можно обойти земной шар по экватору примерно за 18,5 суток. Этот срок занимает промежуточное положение (близкое к среднему геометрическому) между сутками и годом. Следовательно, для оценки скорости ветров подходит меньший период, то есть одни сутки.
Если считать, что большая часть массы атмосферного воздуха (>95%) находится на высотах меньших H = 30 км, то имеется характерный продольный (по касательной к поверхности Земли) размер атмосферы ( L = 2cdotsqrt{R_{text{Земли}}cdot H} approx 880 ) км. Воздух, движущийся со скоростью 25 м/с, преодолевает такое расстояние за 10 часов, то есть примерно за половину суток.
Еще одно характерное время — это время, которое требуется, чтобы прогреть всю атмосферу Земли от радиационной температуры (250 К) до средней температуры у поверхности Земли (283 К) в предположении, что тепловые потери в космос отсутствуют. Это примерно 17 суток. Этот срок гораздо больше суток и с учетом тепловых потерь характерное время по этому параметру увеличивается до полутора месяцев (правда, это все равно сильно меньше года). Из-за этого, собственно, в средних широтах максимальные летние температуры приходятся не на конец июня, когда суточное количество солнечной энергии, получаемой в северном полушарии, максимально, а на первую половину августа. И то же самое в отношении зимы: самое холодное время в среднем — это не конец декабря, а январь-февраль.