Время на прочтение
7 мин
Количество просмотров 19K
Практика показывает, что в современном мире Docker-контейнеров и оркестраторов (Kubernetes, Nomad, etc) проблема с утечкой памяти может быть обнаружена не при локальной разработке, а в ходе нагрузочного тестирования, или даже в production-среде. В этой статье рассмотрим:
-
Причины появления утечек в Python-приложениях.
-
Доступные инструменты для отладки и мониторинга работающего приложения.
-
Общую методику поиска утечек памяти.
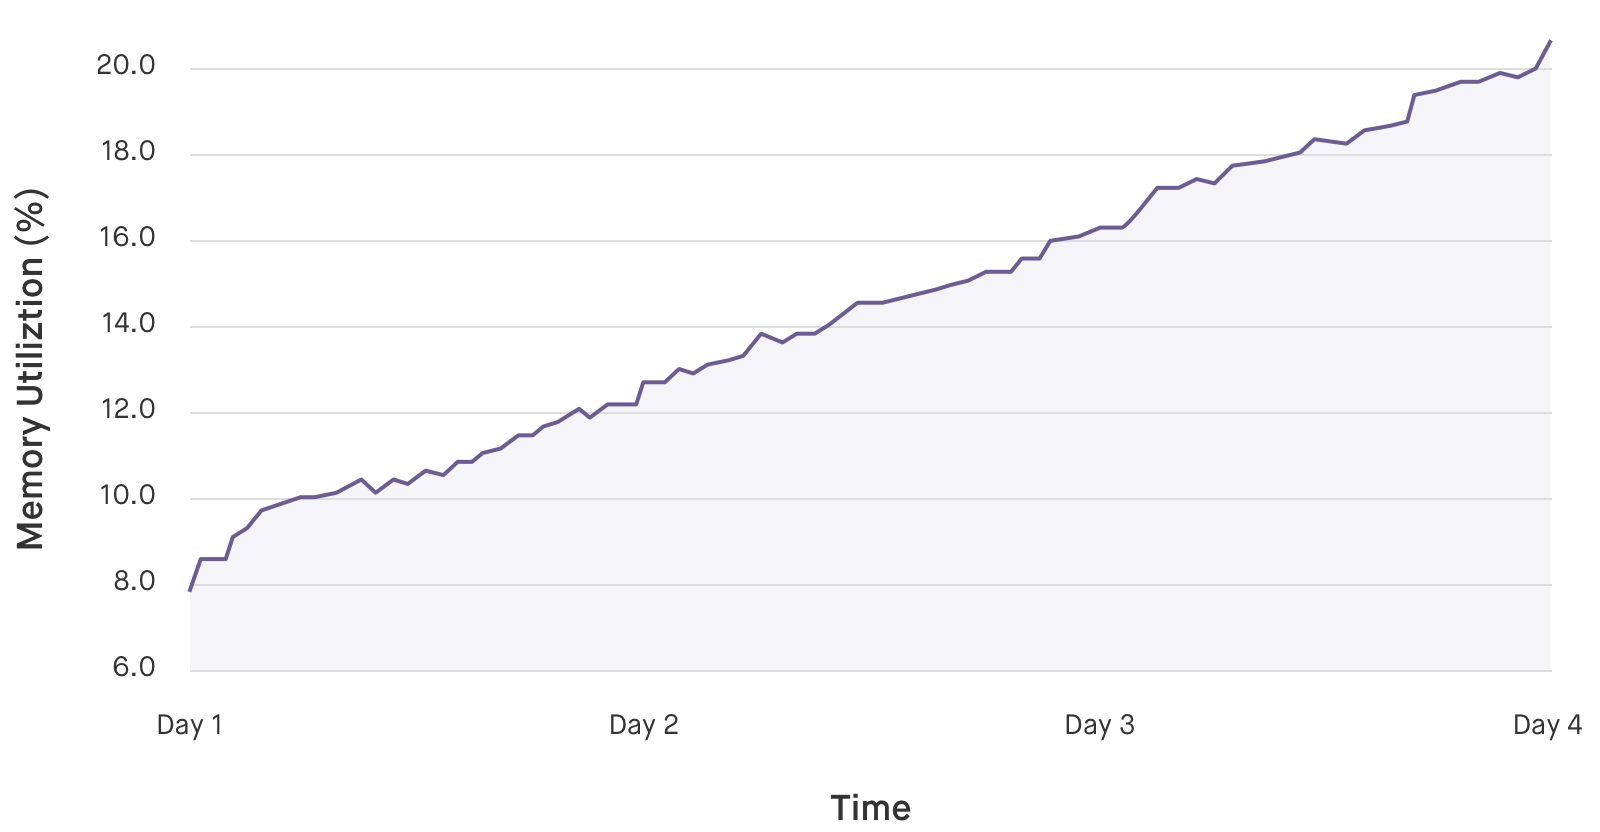
У нас есть много фреймворков и технологий, которые уже «из коробки» работают замечательно, что усыпляет бдительность. В итоге иногда тревога поднимается спустя некоторое время после проблемного релиза, когда на мониторинге появляется примерно такая картина:

Утечки плохи не только тем, что приложение начинает потреблять больше памяти. С большой вероятностью также будет наблюдаться снижение работоспособности, потому что GC придется обрабатывать всё больше и больше объектов, а аллокатору Python — чаще выделять память для новых объектов.
Заранее предупрежу, что рассмотренные методы отладки приложения крайне не рекомендованы для использования в production-среде. Область их применения сводится к ситуациям:
-
Есть подозрение на утечку памяти. Причина абсолютно непонятна и проявляется при production-сценариях/нагрузках.
-
Мы разворачиваем приложение в тестовой среде и даем тестовый трафик, аналогичный тому, при котором появляется утечка.
-
Смотрим, какие объекты создаются, и почему память не отдается операционной системе.
Глобально утечка может произойти в следующих местах:
-
Код на Python. Здесь всё просто: создаются объекты в куче, которые не могут быть удалены из-за наличия ссылок.
-
Подключаемые библиотеки на других языках (C/C++, Rust, etc). Утечку в сторонних библиотеках искать гораздо сложнее, чем в коде на Python. Но методика есть, и мы ее рассмотрим.
-
Интерпретатор Python. Эти случаи редки, но возможны. Их стоит рассматривать, если остальные методы диагностики не дали результата.
Подключение к работающему приложению
-
PDB — старый добрый Python Debugger, о котором стали забывать из-за красивого интерфейса для отладки в современных IDE. На мой взгляд, для поиска утечек памяти крайне неудобен.
-
aiomonitor. Отличное решение для асинхронных приложений. Запускается в отдельной корутине и позволяет подключиться к работающему приложению с помощью NetCat. Предоставляет доступ к полноценному интерпретатору без блокировки основного приложения.
-
pyrasite. Запускается в отдельном процессе, и также как aiomonitor не блокирует и не останавливает основной поток, — можно смотреть текущее состояние переменных и памяти. Для работы pyrasite требуется установленный gdb. Это накладывает ограничения на использование, например, в Docker — требуется запуск контейнера с привилегированными правами и включение ptrace.
Утечки памяти: большие объекты
Это самые простые утечки памяти, потому что большие объекты очень легко отфильтровать. Для поиска будем использовать pympler и отладку через aiomonitor.
Запустим в первом окне терминала main.py:
import tracemalloc

tracemalloc.start()

from aiohttp import web
import asyncio
import random
import logging
import sys
import aiomonitor


logger = logging.getLogger(__name__)


async def leaking(app):
    """
    Стартап утекающей корутины
    """

    stop = asyncio.Event()

    async def leaking_coro():
        """
        Утекающая корутина
        """
        data = []
        i = 0

        logger.info('Leaking: start')

        while not stop.is_set():
            i += 1
            try:
                return await asyncio.wait_for(stop.wait(), timeout=1)
            except asyncio.TimeoutError:
                pass
            # ЗДЕСЬ БУДЕМ УТЕКАТЬ!
            data.append('hi' * random.randint(10_000, 20_000))
            if i % 2 == 0:
                logger.info('Current size = %s', sys.getsizeof(data))

    leaking_future = asyncio.ensure_future(asyncio.shield(leaking_coro()))
    yield
    stop.set()

if __name__ == '__main__':
    logging.basicConfig(level=logging.INFO)
    loop = asyncio.get_event_loop()

    with aiomonitor.start_monitor(loop=loop):
        app = web.Application()
        app.cleanup_ctx.append(leaking)
        web.run_app(app, port=8000)
И подключимся к нему во втором:
nc 127.0.0.1 50101

Asyncio Monitor: 2 tasks running
Type help for available commands

monitor >>> console
Нас интересует отсортированный дамп объектов GC:
>>> from pympler import muppy
>>> all_objects = muppy.get_objects()
>>> top_10 = muppy.sort(all_objects)[-10:]
>>> top1 = top_10[0]
Мы можем убедиться, что самым большим объектом является наша добавляемая строка:
>>> type(top1)
<class 'str'>
Забавный факт: вызов pprint выводит информацию не в терминальную сессию aiomonitor, а в исходный скрипт. В то время как обычный print ведет себя наоборот.
Теперь возникает вопрос: как же понять, где этот объект был создан? Вы наверняка заметили запуск tracemalloc в самом начале файла, — он нам и поможет:
>>> import  tracemalloc
>>> tb = tracemalloc.get_object_traceback(top1)
>>> tb.format()
['  File "main.py", line 41', "    data.append('hi' * random.randint(10_000, 20_000))"]
Просто и изящно! Для корректной работы tracemalloc должен быть запущен перед любыми другими импортами и командами. Также его можно запустить с помощью флага -X tracemalloc или установки переменной окружения PYTHONTRACEMALLOC=1 (подробнее: https://docs.python.org/3/library/tracemalloc.html). Чуть ниже мы рассмотрим другие полезные функции tracemalloc.
Утечки памяти: много маленьких объектов
Представим, что в нашей программе начал утекать бесконечный связный список: много однотипных маленьких объектов. Попробуем отыскать утечку такого рода.
import tracemalloc

tracemalloc.start()

import asyncio

root = {
    'prev': None,
    'next': None,
    'id': 0
}


async def leaking_func():
    current = root
    n = 0

    while True:

        n += 1

        _next = {
            'prev': current,
            'next': None,
            'id': n
        }
        current['next'] = _next
        current = _next

        await asyncio.sleep(0.1)

if __name__ == '__main__':
    loop = asyncio.get_event_loop()
    with aiomonitor.start_monitor(loop=loop):
        loop.run_until_complete(leaking_func())
Как и в прошлом примере, подключимся к работающему приложению, но для поиска маленьких объектов будем использовать objgraph:
>>> import objgraph
>>> objgraph.show_growth()

function                       6790     +6790
dict                           3559     +3559
tuple                          2676     +2676
list                           2246     +2246
weakref                        1635     +1635
wrapper_descriptor             1283     +1283
getset_descriptor              1150     +1150
method_descriptor              1128     +1128
builtin_function_or_method     1103     +1103
type                            949      +949
Во время первого запуск objgraph посчитает все объекты в куче. Дальнейшие вызовы будут показывать только новые объекты. Попробуем вызвать еще раз:
>>> objgraph.show_growth()
dict     3642       +30
Итак, у нас создается и не удаляется много новых маленьких объектов. Ситуацию усложняет то, что эти объекты имеют очень распространенный тип dict. Вызовем несколько раз функцию get_new_ids с небольшим интервалом:
>>> items = objgraph.get_new_ids()['dict']
>>> # Ждем некоторое время
>>> items = objgraph.get_new_ids()['dict']
>>> items
{4381574400, 4381574720, 4380522368, … }
Посмотрим на созданные объекты более пристально:
>>> from pprint import pprint
>>> # Получим объекты по их id
>>> objects = objgraph.at_addrs(items)
>>> pprint(objects, depth=2)

[{'id': 1077, 'next': {...}, 'prev': {...}},
 {'id': 864, 'next': {...}, 'prev': {...}},
 {'id': 865, 'next': {...}, 'prev': {...}},
 {'id': 866, 'next': {...}, 'prev': {...}},
…]
На данном этапе мы уже можем понять, что это за объекты. Но если утечка происходит в сторонней библиотеке, то наша жизнь усложняется. Посмотрим с помощью вспомогательной функции, какие места в программе наиболее активно выделяют память:
def take_snapshot(prev=None, limit=10):

    res = tracemalloc.take_snapshot()
    res = res.filter_traces([
        tracemalloc.Filter(False, tracemalloc.__file__),
    ])

    if prev is None:
        return res

    st = res.compare_to(prev, 'lineno')
    for stat in st[:limit]:
        print(stat)

    return res

>>> sn = take_snapshot()
>>> # Немного подождем перед вторым вызовом
>>> sn = take_snapshot(sn):

/Users/saborisov/Work/debug_memory_leak/main.py:25 size=27.8 KiB (+27.8 KiB), count=230 (+230), average=124 B
...
Мы явно видим подозрительное место, на которое следует взглянуть более пристально.
Я бы хотел обратить внимание, что за кадром осталась основная функциональность библиотеки objgraph: рисование графов связей объектов. Пожалуйста, попробуйте его, это фантастический инструмент для поиска хитрых утечек! С помощью визуализации ссылок на объект можно быстро понять, где именно осталась неудаленная ссылка.
Сторонние C-Extensions
Это наиболее тяжелый в расследовании тип утечек памяти, потому что GC работает только с PyObject. Если утекает код на C, отследить это с помощью кода на Python невозможно. Искать утечки в сторонних библиотеках следует, если:
-
Основная куча объектов Python не растет (с помощью objgraph и pympler не удается найти утечки памяти).
-
Общая память приложения на Python продолжает бесконтрольно расти.
Для тестирования создадим небольшой модуль на Cython (cython_leak.pyx):
from libc.stdlib cimport malloc

cdef class PySquareArray:
    cdef int *_thisptr
    cdef int _size

    def __cinit__(self, int n):
        # Класс, который создает массив квадратов заданного размера
        cdef int i
        self._size = n

        self._thisptr = <int*>malloc(n * sizeof(int))
        for i in range(n):
            self._thisptr[i] = i * i

    def __iter__(self):
        cdef int i
        for i in range(self._size):
            yield self._thisptr[i]
И установочный файл (setup.py):
from setuptools import setup
from Cython.Build import cythonize

setup(
    name='Hello world app',
    ext_modules=cythonize("cython_leak.pyx"),
    zip_safe=False,
)
Запустим сборку: python setup.py build_ext --inplace
И сделаем скрипт для тестирования утечки (test_cython_leak.py):
from cython_leak import PySquareArray
import random

while True:
    a = PySquareArray(random.randint(10000, 20000))
    for v in a:
        pass
Кажется, все объекты должны корректно создаваться и удаляться. На практике график работы скрипта выглядит примерно так:

Попробуем разобраться в причине с помощью Valgrind. Для этого нам понадобится suppression-файл и отключение Python-аллокатора:
PYTHONMALLOC=malloc valgrind --tool=memcheck --leak-check=full python3 test_cython_leak.pyПосле некоторого времени работы можно посмотреть отчет (нас интересуют блоки definitely lost):
==4765== 79,440 bytes in 1 blocks are definitely lost in loss record 3,351 of 3,352
==4765==    at 0x483B7F3: malloc (in /usr/lib/x86_64-linux-gnu/valgrind/vgpreload_memcheck-amd64-linux.so)
==4765==    by 0x544D13C: __pyx_pf_11cython_leak_13PySquareArray___cinit__ (cython_leak.c:1420)
==4765==    by 0x544D13C: __pyx_pw_11cython_leak_13PySquareArray_1__cinit__ (cython_leak.c:1388)
==4765==    by 0x544D13C: __pyx_tp_new_11cython_leak_PySquareArray (cython_leak.c:1724)
Здесь указан наш класс PySquareArray и утекающая функция cinit. Детали можно изучить в скомпилированном файле cython_leak.c.
В чем же причина утечки? Конечно, в отсутствии деструктора:
from libc.stdlib cimport malloc, free
...
def __dealloc__(self):
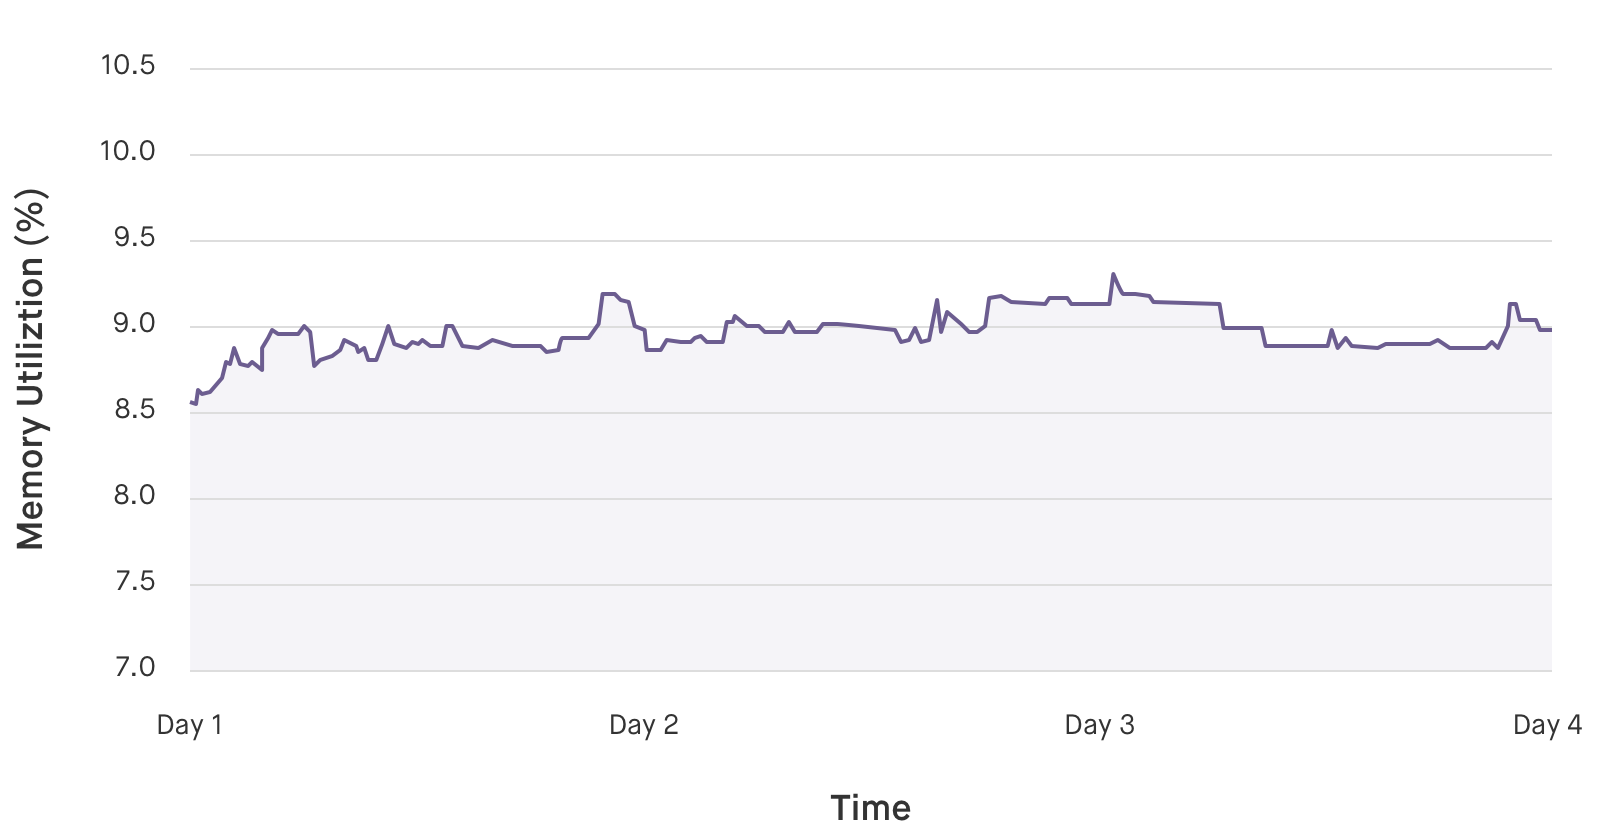
free(self._thisptr)После повторной компиляции и запуска можно увидеть абсолютно корректную работу приложения:
Заключение
Я бы хотел отметить, что в компании мы считаем нагрузочное тестирование приложения с контролем потребления памяти одним из ключевых Quality Gate перед релизом. Я надеюсь, что этот гайд поможет вам быстрее и проще находить утечки памяти в своих приложениях
Memory leaks in Python can occur when objects that are no longer being used are not correctly deallocated by the garbage collector. This can result in the application using more and more memory over time, potentially leading to degraded performance and even crashing. In this article, we will explore how to diagnose and fix memory leaks in Python.
How to Diagnose Memory Leaks in Python
There are several tools that can be used to diagnose memory leaks in Python. Here are a few options:
Tracemalloc module
The tracemalloc module is a built-in Python module that can be used to track the allocation of memory blocks in Python. It can be used to track the source code location where the memory was allocated, as well as the size of the allocated memory block.
To use tracemalloc, you will first need to enable it by calling tracemalloc.start(). Then, you can take a snapshot of the current memory allocation by calling tracemalloc.take_snapshot(). This will return a Snapshot object, which contains information about the memory blocks that are currently allocated.
You can then use the Snapshot.statistics() method to get a list of Statistic objects, which represent the memory blocks that are currently allocated, sorted by the size of the memory blocks. You can use this information to identify the source code locations where the largest memory blocks are being allocated, which may be indicative of a memory leak.
Here’s an example of how to use tracemalloc to take a snapshot and print the statistics:
Python3
import tracemalloc
tracemalloc.start()
a = [1] * (10 ** 6)
snapshot = tracemalloc.take_snapshot()
top_stats = snapshot.statistics('lineno')
for stat in top_stats[:10]:
print(stat)
Output:
6a0aa145-b72e-42a5-a8b2-b92294e6e4d9.py:6: size=7813 KiB, count=2, average=3907 KiB
Objgraph module
The objgraph module is a third-party Python module that can be used to visualize the relationships between objects in Python. It can be used to create a graph of the objects that are currently in memory, which can be helpful in identifying objects that are being retained unnecessarily, potentially leading to a memory leak.
To use objgraph, you will first need to install it using pip install objgraph. Then, you can use the objgraph.show_most_common_types() function to print a list of the most common object types that are currently in memory. You can also use the objgraph.show_backrefs() function to show the references to a specific object, which can be helpful in identifying objects that are being retained unnecessarily.
Python3
import objgraph
a = [1] * (10 ** 6)
b = [2] * (10 ** 6)
objgraph.show_most_common_types()
Output:
This will print a list of the most common object types, along with the number of instances of each type that are currently in memory.
function                   31059
dict                       17893
tuple                      13173
list                       9031
weakref                    6813
cell                       5321
builtin_function_or_method 4139
getset_descriptor          3808
type                       3598
method                     3467
Memory_profiler module
The memory_profiler module is a third-party Python module that can be used to measure the memory usage of Python code. It works by decorating functions or methods with the @profile decorator, which will cause the memory usage to be recorded at each point in the code where the decorated function is called.
To use memory_profiler, you will first need to install it using pip install memory_profiler. Then, you can decorate the functions or methods that you want to profile with the @profile decorator. When you run the code, the memory usage will be recorded at each point where the decorated function is called.
Python3
from memory_profiler import profile
@profile
def my_function():
a = [1] * (10 ** 6)
b = [2] * (10 ** 6)
del a
del b
my_function()
Output:
When you run this code, the memory usage will be recorded at each point where my_function is called. You can then use the recorded memory usage to identify any areas of the code where the memory usage is significantly increasing, which may be indicative of a memory leak.
Filename: c:Userssiddheshdemo.py

Line #    Mem usage    Increment  Occurrences   Line Contents
=============================================================
     3     21.9 MiB     21.9 MiB           1   @profile
     4                                         def my_function():
     5     29.6 MiB      7.6 MiB           1      a = [1] * (10 ** 6)
     6     37.2 MiB      7.6 MiB           1      b = [2] * (10 ** 6)
     7     29.6 MiB     -7.6 MiB           1      del a
     8     21.9 MiB     -7.6 MiB           1      del b
How to Fix Memory Leaks in Python
Once you have identified the source of a memory leak in your Python code, there are a few strategies that you can use to fix it.
Deallocate Unused Objects
One of the most common causes of memory leaks in Python is the retention of objects that are no longer being used. This can occur when an object is referenced by another object, but the reference is never removed. As a result, the garbage collector is unable to deallocate the unused object, leading to a memory leak.
To fix this type of memory leak, you will need to ensure that all references to the unused object are removed when it is no longer needed. This can be done by setting the reference to None or by deleting the reference altogether.
Python3
class MyClass:
def __init__(self):
self.data = [1] * (10 ** 6)
def process_data(self):
result = sum(self.data)
return result
def my_function():
obj = MyClass()
result = obj.process_data()
obj = None
my_function()
In this example, the MyClass object is no longer needed after the process_data method is called. By setting the reference to obj to None, we allow the garbage collector to deallocate the object and avoid a memory leak.
Use Generators or Iterators
Another common cause of memory leaks in Python is the creation of large lists or arrays that are not needed all at once. For example, consider the following code:
Python3
def my_function():
def data_generator():
for i in range(10 ** 6):
yield i
result = sum(data_generator())
print(result)
my_function()
Output:
499999500000
In this example, the data list is created by generating all the integers from 0 to 1 million. This can be very memory intensive, especially if the list is not needed all at once. To avoid this type of memory leak, you can use a generator or iterator instead of creating a large list.
A generator is a special type of function that generates values one at a time, rather than generating a whole list of values at once. To create a generator in Python, you can use the yield keyword instead of return.
Python3
def my_function():
def data_generator():
for i in range(10 ** 6):
yield i
result = sum(data_generator())
print(result)
my_function()
Output:
499999500000
In this example, the data_generator function generates the integers one at a time, allowing us to process them without having to store a large list in memory.
Alternatively, you can use an iterator, which is an object that generates values one at a time when iterated over. To create an iterator in Python, you can implement the __iter__ and __next__ methods in a class. Here’s an example of how to rewrite the above code using an iterator:
Python3
class DataIterator:
def __init__(self):
self.current = 0
def __iter__(self):
return self
def __next__(self):
if self.current >= 10 ** 6:
raise StopIteration
self.current += 1
return self.current
def my_function():
data = DataIterator()
result = sum(data)
print(result)
my_function()
Output:
In this example, the DataIterator class generates the integers one at a time when iterated over, allowing us to process them without having to store a large list in memory.
500000500000
Use Weak References
Another strategy for avoiding memory leaks in Python is to use weak references. A weak reference is a reference to an object that does not prevent the object from being deallocated by the garbage collector. This can be useful in situations where you want to hold a reference to an object, but don’t want to prevent the object from being deallocated when it is no longer needed.
In this example, the weak reference obj_ref can be used to access the MyClass object, but it does not prevent the object from being deallocated by the garbage collector when it is no longer needed.
By using weak references, you can avoid memory leaks caused by the retention of objects that are no longer being used. However, it is important to be aware that weak references can become stale if the object they reference has been deallocated, so you will need to handle these cases appropriately in your code.
To create a weak reference in Python, you can use the weakref module. Here’s an example of how to use a weak reference:
Python3
import weakref
class MyClass:
def __init__(self):
self.data = [1] * (10 ** 6)
def my_function():
obj = MyClass()
obj_ref = weakref.ref(obj)
obj = None
if obj_ref() is not None:
print(obj_ref().data)
else:
print('The object has been deallocated')
my_function()
Output:
The object has been deallocated
Fugue uses Python extensively throughout our cloud security SaaS product and in our support tools, due to its ease-of-use, python security, extensive package library, and powerful language tools. One thing we’ve learned from building complex software for the cloud is that a language is only as good as its debugging and profiling tools. Logic errors, CPU spikes, and memory leaks are inevitable, but a good debugger, CPU profiler, and memory profiler can make finding these errors significantly easier and faster, letting our developers get back to creating Fugue’s dynamic cloud orchestration and enforcement system. Let’s look at a case in point.
In the fall, our metrics reported that a Python component of Fugue called the reflector was experiencing random restarts and instability after a few days of uptime. Looking at memory usage showed that the reflector’s memory footprint increased monotonically and continuously, indicating a memory leak. tracemalloc, a powerful memory tracking tool in the Python standard library, made it possible to quickly diagnose and fix the leak. We discovered that the memory leak was related to our use of requests, a popular third-party Python HTTP library. Rewriting the component to use urllib from the Python standard library eliminated the memory leak. In this blog, we’ll explore the details.

Memory Allocation in Python
In most scenarios, there’s no need to understand memory management in Python beyond knowing that the interpreter manages memory for you. However, when writing large, complex Python programs with high stability requirements, it’s useful to peek behind the curtain to understand how to write code that interacts well with Python’s memory management algorithms. Notably, Python uses reference counting and garbage collection to free memory blocks, and only frees memory to the system when certain internal requirements are met. A pure Python script will never have direct control over memory allocation in the interpreter. If direct control over memory allocation is desired, the interpreter’s memory allocation can be bypassed by writing or using an extension. For example, numpy manages memory for large data arrays using its own memory allocator.
Fundamentally, Python is a garbage-collected language that uses reference counting. The interpreter automatically allocates memory for objects as they are created and tracks the number of references to those objects in a data structure associated with the object itself. This memory will be freed when the reference count for those objects reaches zero. In addition, garbage collection will detect cycles and remove objects that are only referenced in cycles. Every byte of memory allocated within the Python interpreter is able to be freed between these two mechanisms, but no claims can be made about memory allocated in extensions.
Python manages its own heap, separate from the system heap. Memory is allocated in the Python interpreter by different methods according to the type of the object to be created. Scalar types, such as integers and floats, use different memory allocation methods than composite types, such as lists, tuples, and dictionaries. In general, memory is allocated on the Python heap in fixed-size blocks, depending on the type. These blocks are organized into pools, which are further organized into arenas. Memory is pre-allocated using arenas, pools, and blocks, which are then used to store data as needed over the course of program’s execution. Since these blocks, pools, and arenas are kept in Python’s own heap, freeing a memory block merely marks it as available for future use in the interpreter. Freeing memory in Python does not immediately free the memory at the system level. When an entire arena is marked as free, its memory is released by the Python interpreter and returned to the system. However, this may occur infrequently due to memory fragmentation.
Due to these abstractions, memory usage in Python often exhibits high-water-mark behavior, where peak memory usage determines the memory usage for the remainder of execution, regardless of whether that memory is actively being used. Furthermore, the relationship between memory being «freed» in code and being returned to the system is vague and difficult to predict. These behaviors make completely understanding the memory usage of complex Python programs notoriously difficult.
Memory Profiling Using tracemalloc
tracemalloc is a package included in the Python standard library (as of version 3.4). It provides detailed, block-level traces of memory allocation, including the full traceback to the line where the memory allocation occurred, and statistics for the overall memory behavior of a program. The documentation is available here and provides a good introduction to its capabilities. The original Python Enhancement Proposal (PEP) introducing it also has some insight on its design.
tracemalloc can be used to locate high-memory-usage areas of code in two ways:
- looking at cumulative statistics on memory use to identify which object allocations are using the most memory, and
- tracing execution frames to identify where those objects are allocated in the code.
Module-level Memory Usage
We start by tracing the memory usage of the entire program, so we can identify, at a high level, which objects are using the most memory. This will hopefully provide us with enough insight to know where and how to look more deeply. The following wrapper starts tracing and prints statistics when Ctrl-C is hit:
import tracemalloctracemalloc.start(10)
try:
	run_reflector()
except:
	snapshot = tracemalloc.take_snapshot()
	top_n(25, snapshot, trace_type='filename')
tracemalloc.start(10) starts memory tracing, while saving 10 frames of traceback for each entry. The default is 1, but saving more traceback frames is useful if you plan on using tracebacks to locate memory leaks, which will be discussed later. tracemalloc.take_snapshot() takes a snapshot of currently allocated memory in the Python heap. It stores the number of allocated blocks, their size, and tracebacks to identify which lines of code allocated which blocks of memory. Once a snapshot is created, we can compute statistics on memory use, compare snapshots, or save them to analyze later. top_n is a helper function I wrote to pretty print the output from tracemalloc. Here, I ask for the top 25 memory allocations in the snapshot, grouped by filename. After running for a few minutes, the output looks like this:
[ Top 25 with filename tracebacks ]
197618 blocks 17.02311134338379 MB/Users/mike/.pyenv/versions/3.4.2/lib/python3.4/collections/__init__.py:0: size=17.0 MiB,
 count=197618,
 average=90 B105364 blocks 11.34091567993164 MB frozen importlib._bootstrap:0:
size=11.3 MiB,
count=105364,
average=113 B60339 blocks 9.233230590820312 MB/Users/mike/.pyenv/versions/3.4.2/lib/python3.4/json/decoder.py:0:
size=9455 KiB,
count=60339,
average=160 B...
This shows the cumulative amount of memory allocated by the component over the entire runtime, grouped by filename. At this level of granularity, it’s hard to make sense of the results. For instance, the first line shows us that 17 MB of collections objects are created, but this view doesn’t provide enough detail for us to know which objects, or where they’re being used. A different approach is needed to isolate the problem.

Understanding tracemalloc Output
tracemalloc shows the net memory usage at the time a memory snapshot is taken. When comparing two snapshots, it shows the net memory usage between the two snapshots. If memory is allocated and freed between snapshots, it won’t be shown in the output. Therefore, if snapshots are created at the same point in a loop, any memory allocations visible in the differences between two snapshots are contributing to the long-term total amount of memory used, rather than being a temporary allocation made in the course of execution.
In the case of reference cycles that require garbage collection, uncollected cycles are recorded in the output, while collected cycles are not. Any blocks freed by the garbage collector in the time covered by a snapshot will be recorded as freed memory. Therefore, forcing garbage collection with gc.collect() before taking a snapshot will reduce noise in the output.
Per-Iteration Memory Usage
Since we’re looking for a memory leak, it’s useful to understand how the memory usage of our program changes over time. We can instrument the main loop of the component, to see how much memory is allocated in each iteration, by calling the following method from the main loop:
def collect_stats(self):
self.snapshots.append(tracemalloc.take_snapshot())
if len(self.snapshots)  1:

stats = self.snapshots[-1].filter_traces(filters).compare_to(self.snapshots[-2], 'filename')

for stat in stats[:10]:
print("{} new KiB {} total KiB {} new {} total memory blocks: ".format(stat.size_diff/1024, stat.size / 1024, stat.count_diff ,stat.count))
for line in stat.traceback.format():
print(line)
This code takes a memory snapshot and saves it, then uses snapshot.compare_to(other_snapshot, group_by='filename') to compare the newest snapshot with the previous snapshot, with results grouped by filename. After a few iterations to warm up memory, the output looks like this:
[ Top 5 with filename tracebacks ]190.7421875
new KiB 1356.5634765625 total KiB 1930
new 13574 total memory blocks:
(1)  File "/Users/mike/.pyenv/versions/3.4.2/lib/python3.4/linecache.py",

line 02.1328125
new KiB 12.375 total KiB 32
new 86 total memory blocks:

(2)  File "/Users/mike/.pyenv/versions/3.4.2/lib/python3.4/tracemalloc.py",
line 01.859375
new KiB 18.7001953125 total KiB 3
new 53 total memory blocks:

(3)  File "/Users/mike/.pyenv/versions/venv/lib/python3.4/site-packages/requests/packages/urllib3/connection.py",
line 0-1.71875
new KiB 34.5224609375 total KiB -2
new 91 total memory blocks:   File "/Users/mike/.pyenv/versions/venv/lib/python3.4/site-packages/requests/packages/urllib3/connectionpool.py",
line 01.66015625 new KiB 61.662109375 total KiB 18 new 260 total memory blocks:
File "/Users/mike/.pyenv/versions/3.4.2/lib/python3.4/urllib/parse.py", line 0
The linecache (1) and tracemalloc (2) allocations are part of the instrumentation, but we can also see some memory allocations made by the requests HTTP package (3) that warrant further investigation. Recall that tracemalloc tracks net memory usage, so these memory allocations are accumulating on each iteration. Although the individual allocations are small and don’t jump out as problematic, the memory leak only becomes apparent over the course of a few days, so it’s likely to be a case of small losses adding up.
Filtering Snapshots
Now that we have an idea of where to look, we can use tracemalloc’s filtering capabilities to show only memory allocations related to the requests package:
from tracemalloc
import Filter
filters = [Filter(inclusive=True, filename_pattern="*requests*")]
filtered_stats = snapshot.filter_traces(filters).compare_to(old_snapshot.filter_traces(filters), 'traceback')
for stat in stats[:10]:
	print("{}
	new KiB {}
	total KiB {}
	new {}
	total memory blocks: ".format(stat.size_diff/1024, stat.size / 1024, stat.count_diff ,stat.count))

	for line in stat.traceback.format():
	print(line)
snapshot.filter_traces() takes a list of Filters to apply to the snapshot. Here, we create a Filter in inclusive mode, so it includes only traces that match the filename_pattern. When inclusive is False, the filter excludes traces that match the filename_pattern. The filename_pattern uses UNIX-style wildcards to match filenames in the traceback. In this example, the wildcards in «requests» match occurrences of «requests» in the middle of a path, such as "/Users/mike/.pyenv/versions/venv/lib/python3.4/site-packages/requests/sessions.py".
We then use compare_to() to compare the results to the previous snapshot. The filtered output is below:
48.7890625
new KiB 373.974609375 total KiB 4
new 1440 total memory blocks:

(4)  File "/Users/mike/.pyenv/versions/venv/lib/python3.4/site-packages/requests/structures.py",
line 01.46875
new KiB 16.2939453125 total KiB 2
new 49 total memory blocks:

File "/Users/mike/.pyenv/versions/venv/lib/python3.4/site-packages/requests_unixsocket/__init__.py",
line 0 -1.4453125

new KiB 34.2802734375 total KiB -2
new 96 total memory blocks:

(5)  File "/Users/mike/.pyenv/versions/venv/lib/python3.4/site-packages/requests/sessions.py",
line 0-0.859375
new KiB 31.8505859375 total KiB -1
new 85 total memory blocks:

File "/Users/mike/.pyenv/versions/venv/lib/python3.4/site-packages/requests/packages/urllib3/connectionpool.py",
line 00.6484375
new KiB 20.8330078125 total KiB 1
new 56 total memory blocks:
File "/Users/mike/.pyenv/versions/venv/lib/python3.4/site-packages/requests/packages/urllib3/connection.py", line 0
With the Filter in place, we can clearly see how requests is using memory. Line (4) shows that roughly 50 KiB of memory is lost in requests on each iteration of the main loop. Note that negative memory allocations, such as (5), are visible in this output. These allocations are freeing memory allocated in previous loop iterations.

Tracking Down Memory Allocations
To determine which uses of requests are leaking memory, we can take a detailed look at where problematic memory allocations occur by calling compare_to() with traceback instead of filename, while using a Filter to narrow down the output:
stats = snapshot.filter_traces(filters).compare_to(old_snapshot.filter_traces(filters), 'traceback')This prints 10 frames of traceback (since we started tracing with tracemalloc.start(10)) for each entry in the output, a truncated example of which is below:
5 memory blocks: 4.4921875 KiB
File "/Users/mike/.pyenv/versions/venv/lib/python3.4/site-packages/requests/sessions.py",
line 585
r = adapter.send(request, **kwargs)
File "/Users/mike/.pyenv/versions/venv/lib/python3.4/site-packages/requests/sessions.py",
line 475
resp = self.send(prep, **send_kwargs)
File "/Users/mike/.pyenv/versions/venv/lib/python3.4/site-packages/requests_unixsocket/__init__.py",
line 46
return session.request(method=method, url=url, **kwargs)
File "/Users/mike/.pyenv/versions/venv/lib/python3.4/site-packages/requests_unixsocket/__init__.py",
line 60
return request('post', url, data=data, json=json, **kwargs)
The full traceback gives us the ability to trace backwards from memory allocations to the lines in our project code that generate them. In the case of this component, our uses of requests came from an internal storage library that used an HTTP API. Rewriting the library to use urllib directly eliminated the memory leak.
urllib.
Memory Profiling: Art or Science?
tracemalloc is a powerful tool for understanding the memory usage of Python programs. It helped us understand module-level memory usage, find out which objects are being allocated the most, and it demonstrated how the reflector’s memory usage changed on a per-iteration basis. It comes with useful filtering tools and gives us the ability to see the full traceback for any memory allocation. Despite all of its features, however, finding memory leaks in Python can still feel like more of an art than a science. Memory profilers give us the ability to see how memory is being used, but oftentimes it’s difficult to find the exact memory allocation that is causing problems. It’s up to us to synthesize the information we get from our tools into a conclusion about the memory behavior of the program, then make a decision about what actions to take from there.
We use virtually every available Python tool (test frameworks, cProfile, etc.) to make Fugue’s system reliable, performant, and easy to maintain. The broker and reflector both take advantage of Python’s introspection to make judgments about dynamic calls to the AWS API, which allows us to focus on logic rather than coding exhaustive cases. Fugue leverages the strengths of Python where it makes sense in the system, which ultimately means more product stability and extensibility for end-users.
Новинка в версии 3.4.
Модуль tracemalloc-это отладочный инструмент для трассировки блоков памяти,выделенных Python.Он предоставляет следующую информацию:
Для трассировки большинства блоков памяти, выделенных Python, модуль следует запустить как можно раньше, установив для переменной среды PYTHONTRACEMALLOC 1 или используя параметр командной строки -X tracemalloc .Функцию tracemalloc.start() можно вызвать во время выполнения, чтобы начать отслеживание распределения памяти Python.
По умолчанию трассировка выделенного блока памяти сохраняет только самый последний кадр (1 кадр). Чтобы сохранить 25 кадров при запуске: установите для переменной среды PYTHONTRACEMALLOC 25 или используйте параметр командной строки -X tracemalloc=25 .
Examples
Показать 10 лучших
Отобразить 10 файлов,выделяющих наибольшее количество памяти:
import tracemalloc

tracemalloc.start()


snapshot = tracemalloc.take_snapshot()
top_stats = snapshot.statistics('lineno')

print("[ Top 10 ]")
for stat in top_stats[:10]:
    print(stat)
Пример вывода тестового комплекта Python:
[ Top 10 ]
<frozen importlib._bootstrap>:716: size=4855 KiB, count=39328, average=126 B
<frozen importlib._bootstrap>:284: size=521 KiB, count=3199, average=167 B
/usr/lib/python3.4/collections/__init__.py:368: size=244 KiB, count=2315, average=108 B
/usr/lib/python3.4/unittest/case.py:381: size=185 KiB, count=779, average=243 B
/usr/lib/python3.4/unittest/case.py:402: size=154 KiB, count=378, average=416 B
/usr/lib/python3.4/abc.py:133: size=88.7 KiB, count=347, average=262 B
<frozen importlib._bootstrap>:1446: size=70.4 KiB, count=911, average=79 B
<frozen importlib._bootstrap>:1454: size=52.0 KiB, count=25, average=2131 B
<string>:5: size=49.7 KiB, count=148, average=344 B
/usr/lib/python3.4/sysconfig.py:411: size=48.0 KiB, count=1, average=48.0 KiB
Мы видим, что Python загрузил 4855 KiB данных (байт-код и константы) из модулей и что модуль collections выделил 244 KiB для создания типов namedtuple .
Дополнительные параметры см. в Snapshot.statistics() .
Compute differences
Сделайте два снимка и отобразите различия:
import tracemalloc
tracemalloc.start()


snapshot1 = tracemalloc.take_snapshot()

snapshot2 = tracemalloc.take_snapshot()

top_stats = snapshot2.compare_to(snapshot1, 'lineno')

print("[ Top 10 differences ]")
for stat in top_stats[:10]:
    print(stat)
Пример вывода до/после выполнения некоторых тестов набора тестов Python:
[ Top 10 differences ]
<frozen importlib._bootstrap>:716: size=8173 KiB (+4428 KiB), count=71332 (+39369), average=117 B
/usr/lib/python3.4/linecache.py:127: size=940 KiB (+940 KiB), count=8106 (+8106), average=119 B
/usr/lib/python3.4/unittest/case.py:571: size=298 KiB (+298 KiB), count=589 (+589), average=519 B
<frozen importlib._bootstrap>:284: size=1005 KiB (+166 KiB), count=7423 (+1526), average=139 B
/usr/lib/python3.4/mimetypes.py:217: size=112 KiB (+112 KiB), count=1334 (+1334), average=86 B
/usr/lib/python3.4/http/server.py:848: size=96.0 KiB (+96.0 KiB), count=1 (+1), average=96.0 KiB
/usr/lib/python3.4/inspect.py:1465: size=83.5 KiB (+83.5 KiB), count=109 (+109), average=784 B
/usr/lib/python3.4/unittest/mock.py:491: size=77.7 KiB (+77.7 KiB), count=143 (+143), average=557 B
/usr/lib/python3.4/urllib/parse.py:476: size=71.8 KiB (+71.8 KiB), count=969 (+969), average=76 B
/usr/lib/python3.4/contextlib.py:38: size=67.2 KiB (+67.2 KiB), count=126 (+126), average=546 B
Мы видим, что Python загрузил 8173 KiB данных модуля (байт-код и константы), и что это на 4428 KiB больше, чем было загружено до тестов, когда был сделан предыдущий снимок. Точно так linecache модуль linecache кэшировал 940 KiB исходного кода Python для форматирования трассировок, причем все это с момента предыдущего снимка.
Если в системе мало свободной памяти, снимки можно записать на диск с помощью метода Snapshot.dump() для анализа снимка в автономном режиме. Затем используйте метод Snapshot.load() , чтобы перезагрузить снимок.
Получить трассировку блока памяти
Код для отображения трассировки самого большого блока памяти:
import tracemalloc


tracemalloc.start(25)


snapshot = tracemalloc.take_snapshot()
top_stats = snapshot.statistics('traceback')


stat = top_stats[0]
print("%s memory blocks: %.1f KiB" % (stat.count, stat.size / 1024))
for line in stat.traceback.format():
    print(line)
Пример вывода набора тестов Python (трассировка ограничена 25 кадрами):
903 memory blocks: 870.1 KiB
  File "<frozen importlib._bootstrap>", line 716
  File "<frozen importlib._bootstrap>", line 1036
  File "<frozen importlib._bootstrap>", line 934
  File "<frozen importlib._bootstrap>", line 1068
  File "<frozen importlib._bootstrap>", line 619
  File "<frozen importlib._bootstrap>", line 1581
  File "<frozen importlib._bootstrap>", line 1614
  File "/usr/lib/python3.4/doctest.py", line 101
    import pdb
  File "<frozen importlib._bootstrap>", line 284
  File "<frozen importlib._bootstrap>", line 938
  File "<frozen importlib._bootstrap>", line 1068
  File "<frozen importlib._bootstrap>", line 619
  File "<frozen importlib._bootstrap>", line 1581
  File "<frozen importlib._bootstrap>", line 1614
  File "/usr/lib/python3.4/test/support/__init__.py", line 1728
    import doctest
  File "/usr/lib/python3.4/test/test_pickletools.py", line 21
    support.run_doctest(pickletools)
  File "/usr/lib/python3.4/test/regrtest.py", line 1276
    test_runner()
  File "/usr/lib/python3.4/test/regrtest.py", line 976
    display_failure=not verbose)
  File "/usr/lib/python3.4/test/regrtest.py", line 761
    match_tests=ns.match_tests)
  File "/usr/lib/python3.4/test/regrtest.py", line 1563
    main()
  File "/usr/lib/python3.4/test/__main__.py", line 3
    regrtest.main_in_temp_cwd()
  File "/usr/lib/python3.4/runpy.py", line 73
    exec(code, run_globals)
  File "/usr/lib/python3.4/runpy.py", line 160
    "__main__", fname, loader, pkg_name)
Мы видим, что большая часть памяти была выделена в модуле importlib для загрузки данных (байт-кода и констант) из модулей: 870.1 KiB . Отслеживание — это место, где importlib загружал данные в последний раз: в строке import pdb модуля doctest . Трассировка может измениться, если загружен новый модуль.
Pretty top
Код для отображения 10 строк, выделяющих большую часть памяти, с красивым выводом, игнорируя <frozen importlib._bootstrap> и <unknown> :
import linecache
import os
import tracemalloc

def display_top(snapshot, key_type='lineno', limit=10):
    snapshot = snapshot.filter_traces((
        tracemalloc.Filter(False, "<frozen importlib._bootstrap>"),
        tracemalloc.Filter(False, "<unknown>"),
    ))
    top_stats = snapshot.statistics(key_type)

    print("Top %s lines" % limit)
    for index, stat in enumerate(top_stats[:limit], 1):
        frame = stat.traceback[0]
        print("#%s: %s:%s: %.1f KiB"
              % (index, frame.filename, frame.lineno, stat.size / 1024))
        line = linecache.getline(frame.filename, frame.lineno).strip()
        if line:
            print('    %s' % line)

    other = top_stats[limit:]
    if other:
        size = sum(stat.size for stat in other)
        print("%s other: %.1f KiB" % (len(other), size / 1024))
    total = sum(stat.size for stat in top_stats)
    print("Total allocated size: %.1f KiB" % (total / 1024))

tracemalloc.start()


snapshot = tracemalloc.take_snapshot()
display_top(snapshot)
Пример вывода тестового комплекта Python:
Top 10 lines

    _b85chars2 = [(a + b) for a in _b85chars for b in _b85chars]

    _a85chars2 = [(a + b) for a in _a85chars for b in _a85chars]

    exec(class_definition, namespace)

    cls = super().__new__(mcls, name, bases, namespace)

    testMethod()

    lines = fp.readlines()

    for a in _hexdig for b in _hexdig}


    self.data = set()

    _b32tab2 = [a + b for a in _b32tab for b in _b32tab]
6220 other: 3602.8 KiB
Total allocated size: 5303.1 KiB
Дополнительные параметры см. в Snapshot.statistics() .
Запись текущего и пикового размера всех отслеживаемых блоков памяти
Следующий код неэффективно вычисляет две суммы, такие как 0 + 1 + 2 + ... , путем создания списка этих чисел. Этот список временно потребляет много памяти. Мы можем использовать get_traced_memory() и reset_peak() , чтобы наблюдать за небольшим использованием памяти после вычисления суммы, а также за пиковым использованием памяти во время вычислений:
import tracemalloc

tracemalloc.start()


large_sum = sum(list(range(100000)))

first_size, first_peak = tracemalloc.get_traced_memory()

tracemalloc.reset_peak()


small_sum = sum(list(range(1000)))

second_size, second_peak = tracemalloc.get_traced_memory()

print(f"{first_size=}, {first_peak=}")
print(f"{second_size=}, {second_peak=}")
Output:
first_size=664, first_peak=3592984
second_size=804, second_peak=29704
Использование reset_peak() гарантирует, что мы сможем точно записать пик во время вычисления small_sum , даже несмотря на то, что он намного меньше, чем общий пиковый размер блоков памяти с момента вызова start() .Без вызова reset_peak() значение second_peak по-прежнему будет пиковым значением из вычисления large_sum (то есть равным first_peak ). В этом случае оба пика намного выше, чем конечное использование памяти, и это предполагает, что мы могли бы оптимизировать (удалив ненужный вызов list и написав sum(range(...)) ).
In production, a memory leak will not always bubble up. And there could be multiple reasons behind it. You may not be getting enough traffic. Frequent deployments. No hard memory usage limit set. Or mix of them.
The flask app we had to debug had same characteristics. It never had huge surge of traffic and there would be multiple deployments over week. Although it had cgroup memory usage limit, it had some room to grow and the leak never appeared. Until we decided to implement cache warmer which would be generating significant traffic and there it goes, uWSGI processes getting killed by OOM Killer!
Update:
I gave a talk at PyCon 2019 on the same subject, if you prefer detailed explanation in video format, checkout PyCon19 India: Let’s Hunt a Memory Leak or just scroll down to the bottom of the page.
A Word on Python Memory Management:
Python does memory management on its own and it’s completely abstracted from user. It generally is not needed to know how is it done internally but when your workers are dying, you gotta know.
Apparently, when certain primitive types of object goes out of scope or you delete it explicitly with del, the memory is not released back to OS and it would still be accounted for the python process. The now free objects would go to something called freelist and would still stay on heap. It is cleared only when garbage collection of highest generation happens. 1
Here we are allocating list of ints and then explicitly deleting it. We will see mem usage with and without GC.
import os, psutil, gc, time


l=[i for i in range(100000000)]
print(psutil.Process(os.getpid()).memory_info())
del l
#gc.collect()
print(psutil.Process(os.getpid()).memory_info())
The results would look like:
# without GC:
pmem(rss=3268038656L, vms=7838482432L, pfaults=993628, pageins=140)
pmem(rss=2571223040L, vms=6978756608L, pfaults=1018820, pageins=140)

# with GC:
pmem(rss=3268042752L, vms=7844773888L, pfaults=993636, pageins=0)
pmem(rss=138530816L, vms=4552351744L, pfaults=1018828, pageins=0)
Look that by deleting, we are going from 3.2G -> 2.5G so still a lots of stuff(mostly int objects) lying around heap. If we also trigger a GC, it goes from 3.2G -> 0.13G. So it memory was not given back to OS until a GC was triggered.
This is just an idea on how does python does memory management. Attaching some reference links as well for more details on how is memory management actually done.
Confirm there’s a leak:
To give bit more context on application which was leaking memory, it was a flask app with traffic mostly on one API endpoint with different parameters.
With the basic knowledge of how python does memory management, we triggered explicit GC with each response sent back. Something like this:
@blueprint.route('/app_metric/<app>')
def get_metric(app):

    response, status = get_metrics_for_app(app)
    gc.collect()
    return jsonify(data=response), status
Even with this gc collection, memory was still gradually increasing with traffic. Meaning? IT’S A LEAK!!
Starting with heap dump:
So we had this uWSGI worker with high memory utilization. I was not aware of any memory profiler which would attach to a running python process and give real-time object allocations. I still am not aware of any such profiler. (A cool project idea?) So a heap dump was taken to analyze what all is lying there. Here’s how it was done:
$> hexdump core.25867 | awk '{printf "%s%s%s%sn%s%s%s%sn", $5,$4,$3,$2,$9,$8,$7,$6}' | sort | uniq -c | sort -nr  | head

1209344 0000000000000000
 748192 0000000000000001
 200862 ffffffffffffffff
 177362 00007f01104e72c0
 169971
 145219 00007f01104e0c70
 140715 fffffffffffffffc
 138963 fffffffffffffffa
 136849 0000000000000002
  99910 00007f01104d86a0
It is number of symbols and symbol address mapping. To know what that object is actually:
$> gdb python core.25867
(gdb) info symbol 0x00007f01104e0c70
PyTuple_Type in section .data of /export/apps/python/3.6.1/lib/libpython3.6m.so.1.0
(gdb) info symbol 0x00007f01104d86a0
PyLong_Type in section .data of /export/apps/python/3.6.1/lib/libpython3.6m.so.1.0
So there are lot of tuples and longs (int objects) on the heap. So what? Heap dump does tell what is there on heap but it does not tell who put it there. So this was useless.
Let’s track memory allocations:
There was no other way but to track memory allocations. There are number of python modules available which helps you do that. But they need to be installed separately and since 3.4 python comes bundling tracemalloc 2. Tracemalloc tracks memory allocations and point it to line/module where object was allocated with size. You can also take snapshots at random point in code path and compare memory difference between those two points.
Perfect! Since it’s a flask app, it’s supposed to be stateless and there should not be permanent memory allocations between API calls (which was not the case here). So how do we take snapshot of memory and track memory allocations between API calls, it’s stateless.
For love of monkey-patching and the lack of time on Friday evening, this was the best I could come up with: Pass a query parameter in HTTP request which would take a snapshot. Pass a different parameter which would take another snapshot and compare it with the first one! Neat? Here’s how it looks:
import tracemalloc
tracemalloc.start()
s1=None
s2=None
...
@blueprint.route('/app_metric/<app>')
 def get_metric(app):
     global s1,s2
     trace = request.args.get('trace',None)

     response, status = get_metrics_for_app(app)

     if trace == 's2':
         s2=tracemalloc.take_snapshot()
         for i in s2.compare_to(s1,'lineno')[:10]:
             print(i)
     elif trace == 's1':
         s1=tracemalloc.take_snapshot()
     return jsonify(data=response), status
When trace=s1 is passed with request, a memory snapshot is taken. When trace=s2 is passed, another snapshot is taken and it is compared with the first snapshot. We will be printing the difference and that would tell who allocated how much memory between these two requests.
Hello, leak!
The output of snapshot difference looked like this:
/<some>/<path>/<here>/foo_module.py:65: size=3326 KiB (+2616 KiB), count=60631 (+30380), average=56 B
/<another>/<path>/<here>/requests-2.18.4-py2.py3-none-any.whl.68063c775939721f06119bc4831f90dd94bb1355/requests-2.18.4-py2.py3-none-any.whl/requests/models.py:823: size=604 KiB (+604 KiB), count=4 (+3), average=151 KiB
/export/apps/python/3.6/lib/python3.6/threading.py:884: size=50.9 KiB (+27.9 KiB), count=62 (+34), average=840 B
/export/apps/python/3.6/lib/python3.6/threading.py:864: size=49.0 KiB (+26.2 KiB), count=59 (+31), average=851 B
/export/apps/python/3.6/lib/python3.6/queue.py:164: size=38.0 KiB (+20.2 KiB), count=64 (+34), average=608 B
/export/apps/python/3.6/lib/python3.6/threading.py:798: size=19.7 KiB (+19.7 KiB), count=35 (+35), average=576 B
/export/apps/python/3.6/lib/python3.6/threading.py:364: size=18.6 KiB (+18.0 KiB), count=36 (+35), average=528 B
/export/apps/python/3.6/lib/python3.6/multiprocessing/pool.py:108: size=27.8 KiB (+15.0 KiB), count=54 (+29), average=528 B
/export/apps/python/3.6/lib/python3.6/threading.py:916: size=27.6 KiB (+14.5 KiB), count=57 (+30), average=496 B
<unknown>:0: size=25.3 KiB (+12.4 KiB), count=53 (+26), average=488 B
Turns out, we had a custom module which we were using to make downstream calls to get data for response. That custom modules override the threadpool module to get profiling data ie: how much time did it take to do the downstream call. And for some reason, the result of profiling was appended to a list which was class variable! Which was 2600KB in size (the first line) and this was done for every incoming request. It looked something like this:
class Profiler(object):
    ...
    results = []
    ...
    def end():
      timing = get_end_time()
      results.append(timing)
      ...
Guess who had a happy Friday! 
Interesting reads:
- https://hbfs.wordpress.com/2013/01/01/python-memory-management-part-i/
- https://hbfs.wordpress.com/2013/01/08/python-memory-management-part-ii/
- https://rushter.com/blog/python-memory-managment
- https://rushter.com/blog/python-garbage-collector