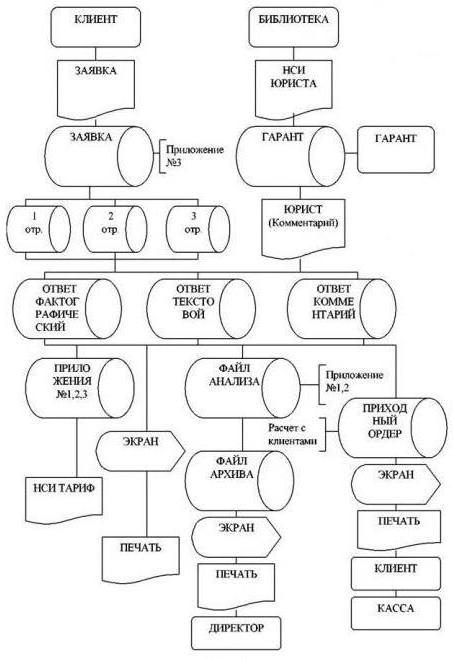
Последовательность построения описательной модели
•Модель объекта можно построить, только наблюдая за ним. То, что мы наблюдаем, необходимо закодировать либо с помощью слов, либо символов, в частности, математических, либо графических образов, либо в виде физических предметов, процессов или явлений. И наконец, закодированные результаты наблюдения надо зафиксировать в виде модели. Поскольку к моделированию мы прибегаем из-за сложности изучаемого объекта, то модель заведомо проще оригинала.
Проблема использования моделей
•каждая модель создается под
определенную исследовательскую
задачу и не всегда применима к
решению других, какой бы привлекательной модель ни была. Распространённый в науке перенос моделей с одной задачи на другую далеко не всегда оправдан и обоснован.
Нормативное моделирование
•В случае необходимости создания новых объектов, прибегают к нормативному моделированию.
•Нормативные модели предназначены для указания целей деятельности и определённого порядка (алгоритма) действий для их достижения.
•Цель – образ желаемого будущего, т. е. модель состояния, на реализацию которого и направлена деятельность.
•Алгоритм – образ (модель) будущей деятельности.
•При нормативном моделировании обычно не используют слово «модель» — чаще говорят «проект», «план».
•Примеры. Проекты машин, зданий; планы застройки; законы; уставы организаций и должностные инструкции, бизнес-планы, программы действий, управленческие решения.
Сравнение описательных и нормативных моделей
•Описательные модели отражают
существующее, их развитие направлено на приближение модели к реальности.
•Нормативные модели показывают не существующее, но желаемое. Здесь решается задача приближения реальности к модели, поскольку модель играет роль стандарта или образца, под который «подгоняются» как сама деятельность, так и её результаты.
Классификация моделей
•По функциональному назначению. Можно выделить следующие функции, выполняемые моделями:
•исследовательская – применяется в научном познании;
•практическая – применяется в практической деятельности (проектировании, управлении и т. п.);
•тренинговая – используется для тренировки практических умений и навыков специалистов в
различных областях;
•обучения – для формирования у обучаемых знаний, умений и навыков.
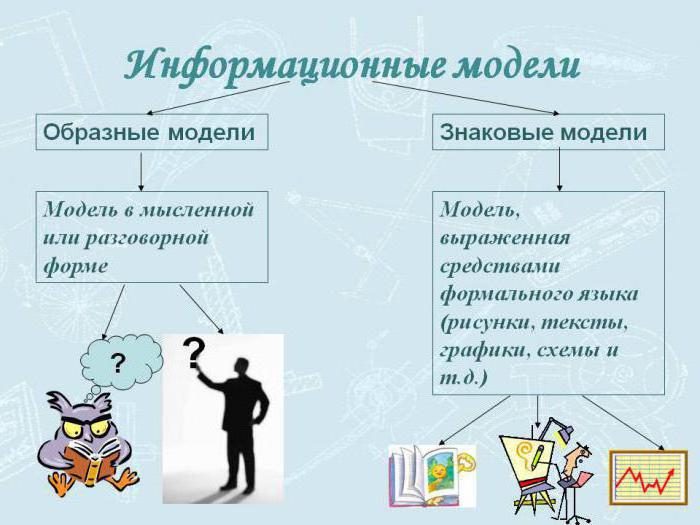
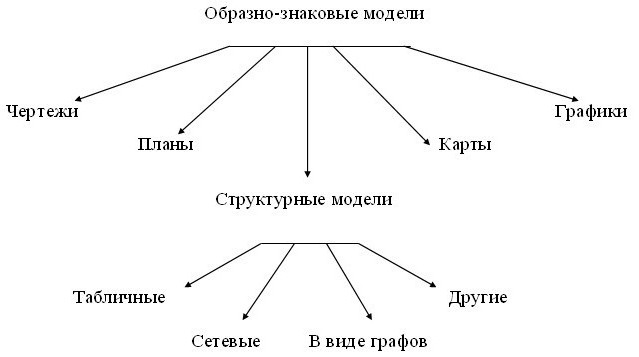
Формы представления моделей
•Модели по форме бывают:
•• физические – материальные объекты, имеющие сходство с оригиналом (модель самолета, которая исследуется в аэродинамической трубе; модель плотины);
•словесные (вербальные) — словесное описание чего- либо (внешность человека, принцип работы устройства, структура предприятия);
•графические – описание в виде графических изображений (схемы, карты, графики, диаграммы);
•знаковые – описание в виде символов и знаков (дорожные знаки, условные обозначения на схемах, математические соотношения). Разновидностью знаковых моделей являются математические модели.
Математическая модель (или математическое описание)
– это система математических соотношений, описывающих изучаемый процесс или явление.
Виды моделирования
•Применительно к естественно-техническим, социально- экономическим и другим наукам принято различать следующие виды моделирования:
•концептуальное моделирование, при котором с помощью некоторых специальных знаков, символов, операций над ними или с помощью естественного или искусственного языков истолковывается основная мысль (концепция) относительно исследуемого объекта;
•интуитивное моделирование, которое сводится к мысленному эксперименту на основе практического опыта работников (широко применяется в экономике);
•физическое моделирование, при котором модель и моделируемый объект представляют собой реальные объекты или процессы единой или различной физической природы, причем между процессами в объекте-оригинале и в модели выполняются некоторые соотношения подобия, вытекающие из схожести физических явлений;
Виды моделирования
• структурно-функциональное моделирование,
при котором моделями являются схемы, (блок- схемы), графики, чертежи, диаграммы, таблицы, рисунки, дополненные специальными правилами их объединения и преобразования:
• математическое (логико-математическое) моделирование, при котором моделирование, включая построение модели, осуществляется средствами математики и логики;
• имитационное (программное) моделирование,
при котором логико-математическая модель исследуемого объекта представляет собой алгоритм функционирования объекта, реализованный в виде программного комплекса для компьютера.
Виды моделирования
•Развитием имитационного моделирования считается
компьютерное моделирование.
•Первоначально под компьютерной моделью чаще всего понимали имитационную модель – отдельную программу, совокупность программ или программный комплекс, позволяющий с помощью последовательности вычислений и графического отображения их результатов воспроизводить (имитировать) процессы функционирования объекта.
В настоящее время под компьютерной моделью чаще всего понимают структурно-функциональную модель – условный образ объекта, описанный с помощью взаимосвязанных компьютерных таблиц, блок-схем, диаграмм, графиков, рисунков, анимационных фрагментов, гипертекстов и отображающий структуру и взаимосвязи между элементами объекта.
Компьютерное моделирование – это метод решения задачи анализа или синтеза объекта на основе использования его
компьютерной модели.
Виды моделирования
•Суть компьютерного моделирования заключена в получении количественных и качественных результатов по имеющейся модели. Качественные выводы, получаемые по результатам анализа, позволяют обнаружить неизвестные ранее свойства объекта. Количественные выводы в основном носят характер прогноза некоторых будущих или объяснения прошлых значений переменных, характеризирующих систему.
•Предметом компьютерного моделирования
могут быть: экономическая деятельность фирмы или банка, промышленное предприятие, информационно-вычислительная сеть, технологический процесс, любой реальный объект или процесс, например процесс инфляции.
Соседние файлы в папке Новая папка
- #
- #
- #
- #
- #
- #
- #
- #
29.03.201692.73 Кб12Семинары 437-436 гр 2015 ТСиСА 2 модуль послед.xlsx
- #
29.03.201666.61 Кб12Семинары 437-436 гр 2015 ТСиСА 2 модуль.xlsx
Методическая разработка. «Использование схем-моделей при
составлении описательных рассказов о предмете в старшей группе».
На сегодняшний
день — речь у детей дошкольного возраста не богата распространёнными
предложениями. В речи ребят существуют множество проблем. Односложная,
состоящая лишь из простых предложений. грамматически Дети не могут правильно
построить распространенное предложение. Бедная диалогическая речь:
неспособность грамотно и доступно сформулировать вопрос, построить краткий или
развернутый ответ. Особенно сложно ребятам построить монолог: например,
сюжетный или описательный рассказ на предложенную тему, пересказ текста своими
словами. Также дети испытывают трудности при обосновании своего ответа. Поэтому
необходимо научить детей связно, последовательно, грамматически правильно
излагать свои мысли, рассказывать о различных событиях из окружающей жизни.
Начать обучение можно с составления описательных
рассказов о предмете с использованием схем- моделей. У детей часто возникают
большие трудности в составлении описательных рассказов о одушевлённых и
неодушевлённых предметах, а именно:
Детям трудно самостоятельно определить при
рассматривании предмета его главные свойства и признаки.
Установить последовательность выявленных
признаков.
Удержать в памяти эту последовательность,
которая является планом рассказа описания.
Учитывая, что в данное время дети владеют
избытком информации, необходимо, чтобы процесс обучения был для них интересным,
занимательным, развивающим. Схемы-модели помогают детям с помощью воспитателя,
а также самостоятельно определить главные свойства и признаки рассматриваемого
предмета, установить последовательность изложения выявленных признаков;
обогащают словарный запас детей.
С
помощью данного метода решаются следующие задачи:
— развитие связной и диалогической речи у детей;
— развитие у детей умения с помощью графической
аналогии, а так же с помощью заместителей понимать и рассказывать о предмете;
— обучение детей правильному звукопроизношению;
— развитие у детей умственной активности,
сообразительности, наблюдательности, умения сравнивать, выделять существенные
признаки;
— развитие у детей психических процессов:
мышления, внимания, воображения, памяти.
Данные схемы служат своеобразным зрительным
планом для создания монологов, помогают детям выстраивать:
— строение рассказа,
— последовательность рассказа,
— лексико-грамматическую наполняемость рассказа.
Составлению рассказов по моделям предшествует
большая подготовительная работа, которая проводится на прогулках, на занятиях,
в повседневном общении с детьми. Необходимо систематически наблюдать за
состоянием природы и погоды, за их изменениями.
Для детей дошкольного возраста лучше всего
подходят цветные схемы-модели, т. к. у детей остаются в памяти отдельные образы:
ёлочка- зелёная, колобок –жёлтый и др. Позже изображения усложняются или
заменяются графическим изображением: лиса – оранжевые геометрические фигуры
(круг, квадрат) и др.
Дошкольникам сначала схемы даются в готовом
варианте, т. к. у детей недостаточно развиты технические навыки рисования, но
позднее дети
активно включаются в процесс создания своей схемы.
• модель должна отображать обобщённый образ
предмета;
• раскрывать существенное в объекте;
• замысел по созданию модели следует обсуждать с
детьми, что бы она была им понятна.
В начале работы с моделями дети начинают
испытывать некоторые сложности, им трудно следовать предложенному плану
таблицы. Часто первые рассказы по моделям получаются очень схематичными. Чтобы
сложностей было меньше в программу содержания схем-моделей необходимо вводить
задачи по активизации и обогащению словаря.Суть работы со схемами-
моделями заключается
в следующих этапах:
1. Рассматривание таблицы и разбор того, что на
ней изображено
2. Перекодировка информации, т. е. преобразование
из абстрактных символов в образы.
3. После перекодировки осуществляется пересказ,
составление рассказа по заданной теме и др., то есть происходит отработка
метода запоминания.
С помощью данного метода составляем рассказы о
овощах, фруктах, ягодах, временах года, зверях, птицах, насекомых. Что
позволяет также обобщить и закрепить знания детей о обобщающих понятиях.
Пример
использование модели при составлении рассказа о фрукте:
— как называется фрукт,
— какого он цвета,
— какой формы,
— какой на вкус,
— где растёт,
— какой на ощупь,
— что из него можно приготовить.
Следовательно, можно сделать вывод, что,
анализируя новый материал и графически его обозначая, ребенок (под руководством
взрослых) учится самостоятельности, усидчивости, зрительно воспринимает план
своих действий. У него повышается чувство заинтересованности и ответственности,
появляется удовлетворенность результатами своего труда, совершенствуются такие
психические процессы, как память, внимание, мышление.
Также использование моделей при составлении
описательных рассказов заметно облегчает дошкольникам овладение этим видом
связной речи. Кроме того, наличие зрительного плана делает такие рассказы
чёткими, связными, полными, последовательными. Эти и аналогичные модели можно
использовать не только для составления описательных рассказов, но и для
сравнительных рассказов, придумывания загадок о предметах, а также в таком
важном и сложном разделе работы, как обучение детей самостоятельной постановке
вопросов.
Integrating SysML into a Systems Development Environment
Sanford Friedenthal, … Rick Steiner, in A Practical Guide to SysML (Second Edition), 2012
Descriptive Models
A descriptive model describes the domain it represents in a manner that can be interpreted by humans as well as computers. It can be used for many purposes, such as those described in Chapter 2, Section 2.2.2. It can include behavioral, structural, and other descriptions that establish logical relationships about the system, such as its whole-part relationship, the interconnection between its parts, and the allocation of its behavioral elements to structural elements. Descriptive models are generally not built in a manner that directly supports simulation, animation or execution, but they can be checked for consistency and adherence to the rules of the language, and the logical relationships can be reasoned about.
The system model is a descriptive model that captures the requirements, structure, behavior, and parametric constraints associated with a system and its environment. The system model also captures inter-relationships between elements that represent its requirements, structure, behavior and parametric constraints. Because its modeling language supports various abstraction techniques, the system model also provides the ability to represent many other views of the system, such as a black-box view, white-box view, or a security view of the system. The system model can also be queried and analyzed for consistency, and serves as an integrating framework as described in Section 18.1.1.
Read full chapter
URL:
https://www.sciencedirect.com/science/article/pii/B9780123852069000181
Integrating SysML into a Systems Development Environment
Sanford Friedenthal, … Rick Steiner, in A Practical Guide to SysML (Third Edition), 2015
Descriptive models
A descriptive model describes a system or other entity and its relationship to its environment. It is generally used to help specify and/or understand what the system is, what it does, and how it does it.
A geometric model or spatial model is a descriptive model that represents geometric and/or spatial relationships. Mechanical three-dimensional computer aided design (CAD) models are geometric models that include detailed information, including dimensions, tolerances, and other descriptive data such as material characteristics. A 3D representation of land topography and other features that are often presented as maps and other visualizations is also a kind of spatial model.
A logical model is a descriptive model that primarily represents logical relationships and dependencies such as functional, connectivity, and traceability relationships. Examples of logical models include a circuit design model that describes electrical components and their interconnections, and a model of system composition such as a bill-of-materials.
The system model is a logical model that is introduced in Chapter 2 Section 2.1.2. This model captures the requirements, structure, behavior, and parametric constraints associated with a system and its environment, along with the relationships between these elements. As discussed throughout this book, SysML is a modeling language used to capture the system model. SysML supports various abstraction techniques and provides the ability to represent many different views of the system, such as a black-box view, white-box view, and a security view. The system model can also be queried and analyzed for different purposes, such as providing traceability analysis, assessing the completeness of the model, and validating model correctness.
Read full chapter
URL:
https://www.sciencedirect.com/science/article/pii/B9780128002025000187
Modeling Interaction
I. Scott MacKenzie, in Human-computer Interaction, 2013
7.1.1 Delineating a problem space
A descriptive model can be as simple as a dividing up a problem space. Taken as a whole, without divisions, the problem space is … well, that’s what it is, a space—vast and uncharted, a big fuzzy cloud. However, with a little thought and organization it becomes a partitioned domain. As a partitioned domain, we are empowered to think differently about the problem space, to get inside it and see the constituent parts or processes. We can focus on certain parts of the problem space, consider how one part differs from, or relates to, another, and weigh strengths, weaknesses, advantages, or disadvantages of certain parts over others.
Here is a non-HCI example, just to get started. Consider politics, a subject we all know a little about. Figure 7.1a gives the “big fuzzy cloud” model of politics. Of course, there is no model; it’s just the thing itself, without delineation. If we really want to study politics, it would be useful to break it down, delineate it, categorize it, structure it, or whatever—so we can get inside the problem, define and understand its constituent parts, and begin the process of charting out a corner of the problem space as a research area. In Figure 7.1b, we see Johnson’s (2007, 19) delineation of the problem space for politics. This is a descriptive model for politics. Open any textbook on any subject and you are likely to find similar diagrams.

Figure 7.1. Politics: (a) The “big fuzzy cloud” model. (b) A descriptive model delineating the problem space.
Johnson’s chart in Figure 7.1b is beautifully crafted. It is organized as a semi-circular spoked wheel with politics at the center. Do you like the organization? Is there a different organization that might work better? Note the symmetry between “State/Government” (left) and “Citizens/Communities” (right). Nice. “Ideas/Interests” is mirrored with “Processes.” Is that reasonable? What about “Federalism” under Institutions? That seems odd. Is federalism an institution? Perhaps Federalism, like Democracy, should be under Ideas/Interests. Enough said. The descriptive model in Figure 7.1b adds tremendous insight into politics. With it, we are empowered not only to think differently about the problem, but to think critically about it. With every tweak, refinement, and improvement we get a better model and, more importantly, we get a better understanding of the problem. That’s the power of descriptive models.
In HCI, researchers often approach problems in a similar way. Let’s have a look at a few descriptive models in HCI and examine how they are used to analyze a problem space and inform interaction design.
Read full chapter
URL:
https://www.sciencedirect.com/science/article/pii/B9780124058651000078
Performance Variables and Model Development
Nauman Sheikh, in Implementing Analytics, 2013
Model and Characteristics in Descriptive Modeling
The descriptive models are different in nature from predictive models since they don’t need to perform as accurately as the predictive models need to. Since predictions are for a potential future event and business wants to exploit that knowledge and take actions on the predictions, the reliability of the prediction matters a lot. A descriptive model, on the other hand, is describing the data in a form that allows for future action strategies, but it is not a precise event. Rather, it is a perspective into large quantities of data, so business can make sense of the data. It describes data in clusters or association rules so it doesn’t need to be accurate, just approximate. Descriptive analytics has input variables, but their values and weights function differently. When a descriptive analytics model like clustering is complete or built, here is what you find:
- ■
-
Number of clusters
- ■
-
Cluster affinity (closeness of one cluster to another on the Euclidean plane)
- ■
-
Cluster characteristics:
- ■
-
Cluster name or ID
- ■
-
Input variables and their values (or range of values) in each cluster
- ■
-
Probabilities and correlations of variables within each cluster
That makes the model and its characteristics in descriptive analytics much simpler to review, understand, and use. In predictive analytics, a future event is predicted and that has to be exploited favorably. The focus is the event and, therefore, the usage is tied to the event as well. In contrast, the descriptive model output is an explanation of the data using a structured form like clustering or social network analysis. Once the output is analyzed the question of exploiting this insight becomes wide open to interpretation and innovation. Therefore, the descriptive model’s output is not expected to meet any fixed criteria. This distinction is further explained in the next section.
Read full chapter
URL:
https://www.sciencedirect.com/science/article/pii/B9780124016965000049
Automated Decisions and Business Innovation
Nauman Sheikh, in Implementing Analytics, 2013
Decision Strategy in Descriptive Models
In descriptive models, decision strategies are still needed to address the gray area introduced by descriptive models. In case of outlier detection using clustering, the idea is to supply a large data set to a clustering algorithm and it will plot the data points and look for points that are close to form a cluster. Once the clusters are formed and their definitions have been identified, the descriptive model is ready. When a new observation comes in, it is determined which cluster it is part of or if it is close to a particular cluster. A decision strategy or the clustering software can compute that looking at the ranges of variables within each cluster and the values on the new observation. Once it is determined whether the new observation is in the cluster, the expected future behavior of the new observation will be the same as the rest of the population of the cluster, and therefore a decision can be made about decision on the new observation. On the other hand, if it lies outside a particular cluster, then it must be determined how to apply the insight of the cluster it is closest to. The Euclidean distances of “in the cluster,” “outside the cluster,” and “how far outside the cluster” are all gray areas that need a decision strategy to determine how to treat them.
Similarly, in a social network analysis, if the relationship between two customers is too strong, a certain type of decision is warranted, however, if the relationship is somewhat strong, then a different strategy is required. This again introduces a degree of gray area that requires business rules–based decision strategies. The decision strategies may be a little more volatile initially and they may go through several iterations and adjustments before getting finalized. Apart from that gray area in a model’s output, everything that has been covered in predictive decision strategies applies to descriptive analytics–based decision strategies, as the actions on the analytics’ models are still a set of DVs, their thresholds, and business decisions.
Read full chapter
URL:
https://www.sciencedirect.com/science/article/pii/B9780124016965000050
Business Modeling
Tim Weilkiens, … Kim Nena Duggen, in OCEB 2 Certification Guide (Second Edition), 2016
Abstract
A descriptive model of a whole enterprise consists of vision, mission statements, goals, strategies, and realizing tactics, among other things. The OMG business motivation model (BMM) provides a structure by means of which those terms can be kept apart. Hence it ensures clarity in creating an enterprise model. This chapter explains the main features of the BMM.
The BMM provides a structure for defining and developing a business plan by describing which purposes an enterprise pursues by which means. The BMM is an OMG standard and describes, on the one hand, the goals of an enterprise with a superior vision and, on the other hand, the associated implementation strategies and tactics with their superior missions. The BMM only defines the structure and properties of the BMM elements such as vision, goals, and so on, and describes their semantics. The top-most areas of BMM are: end: describes the vision of the enterprise and the goals and objectives derived thereof; means: describes which means the enterprise deploys to meet the enterprise objective; influencer: describes to which influencers the enterprise is exposed for instance, current market trends, actions of competitors, or internal influencers such as the IT infrastructure; assessment: assesses neutral influencers on goals and means used; and external information: addresses further important topics of business modeling that are not part of BMM but of other standards. The end area is divided into vision and the desired results, which in turn, are subdivided into goals and objectives. The means area is subdivided into missions, courses of action, and directives. The course of action is split into strategies and tactics, and directives into business policies and business rules. The influencers are distinguished by external and internal influencers with reference to the enterprise. The external information comprises organization units, business processes, and business rules.
Read full chapter
URL:
https://www.sciencedirect.com/science/article/pii/B9780128053522000054
Design for inclusivity
Natalie C. Benda, … Rupa S. Valdez, in Design for Health, 2020
Overview
Personas are descriptive models of users that embody important and realistic user characteristics that must be considered in the design process. A model of a persona is typically a one-to-three paragraph description of a user’s personality, characteristics, and use goals related to a specific design problem, often accompanied by a photo for improved realism. From an HF practitioner perspective, personas can be further enhanced through knowledge regarding aspects of the work system, such as social/organizational factors and their interaction with the physical environment.
The use of personas can be helpful in situations where iterative, rapid development is necessary, obtaining sufficient participants for more in-depth forms of user-centered or participatory design is not feasible, or when user testing may require challenging situations for the target participant group(s). For example, one study utilized personas to understand and generate interventions for patient falls, which are dangerous or difficult to recreate, and it may be challenging or harmful for those who experienced the fall to recount what happened (Hignett, Griffiths, Sands, Wolf, & Costantinou, 2013). In another study, personas were used to develop design requirements for alternative augmentative communication (AAC) devices, which help individuals who have trouble speaking and communicating. The use of personas was particularly advantageous in this case because patients requiring AAC devices typically have considerable physical and communicative limitations, making it challenging for them to actively participate in the design process for extended periods of time (Subrahmaniyan et al., 2013). Adlin and Pruitt (2010) and Cooper, Reimann, Cronin, and Noessel (2014), for example, provide detailed methodologies related to the employment of personas in design.
Read full chapter
URL:
https://www.sciencedirect.com/science/article/pii/B9780128164273000154
Oracle Data Mining
Lilian Hobbs, … Pete Smith, in Oracle 10g Data Warehousing, 2005
16.2 Oracle Data Mining Techniques
Data mining problems can be classified into two categories. In some situations you have some idea of what you are looking for—for example, you are interested in customers who are likely to buy a digital camera. This is known as directed or supervised learning. In other cases, you leave it to the mining process to find you something interesting—for example, a high incidence of accidents at a certain intersection. This is called undirected or unsupervised learning. In unsupervised learning, the data mining algorithms describe some intrinsic property or structure of data and hence are sometimes called descriptive models. On the other hand, supervised learning techniques typically use a model to predict the value or behavior of some quantity and are hence called predictive models.
Oracle Data Mining supports various techniques for mining data, each of which falls into one of these two categories.
- 1.
-
Descriptive Models/Unsupervised Learning:
- ▪
-
Association rules or market-basket analysis
- ▪
-
Clustering
- ▪
-
Feature extraction
- 2.
-
Predictive Models/Supervised Learning:
- ▪
-
Classification
- ▪
-
Regression
- ▪
-
Attribute importance
We will look at each of these in some detail. Oracle Data Mining also provides special algorithms for mining of text and for life-sciences applications, which we will not discuss in this book.
16.2.1 Association Rules
We are all familiar with Amazon.com‘s feature—“Hello, Jane! We have some new recommendations for you.” This type of Web-site personalization uses a data mining technique known as association rules. Mining with association rules finds items that occur together frequently. For instance, association ruls may find that a large percentage of users who bought the book The Lord of the Rings also bought the book The Hobbit′. So if you buy The Lord of the Rings, it may recommend you also read The Hobbit.
Data mining using association rules is also known as “market-basket analysis.” When you visit your local grocery store, you may find that the seafood department has lemons or tartar sauce next to the fish. This is because, it has found that 80 percent of people who buy fish also buy lemons to go with it. Most of these stores offer some kind of frequent shopper cards—by keeping a count of what combinations of items have been bought by the same person, they can organize their shelves more appropriately and even send you coupons for the same or similar items for your next visit.
Mining with association rules involves counting how many times a certain group of items occur together. In this case, you do not necessarily know which combination to look for beforehand—hence, this comes under the unsupervised or undirected learning category. The association algorithm comes up with rules of the type “A implies B.” There are two quantities of interest to the user of this algorithm: support and confidence.
- ▪
-
Support tells us the percentage of the transactions where the combination of items A and B occur together. It helps identify combinations that are sufficiently frequent to be of interest (e.g., purchasing fish alone or purchasing fish and lemons together).
- ▪
-
Confidence tells us which percent of transactions that have an item A also have an item B (e.g., how many transactions that have fish also have lemons).
To use association rules, a user must provide the desired level of support and confidence for a rule to be considered interesting. For instance, suppose we specify that for a rule to be interesting, it must have a support of 20 percent and a confidence of 70 percent. If found that in fact 40 percent of all transactions involved the combination fish and lemons, then the combination “fish, lemons” exceeds the minimum support of 20 percent. Now, if we found that 50 percent of all transactions involve fish then the combination “fish, lemons” has confidence (40 / 50) * 100 = 80 percent, so it also meets the minimum confidence criterion. Hence, “fish implies lemons” will be reported as an association rule.
To make meaningful business decisions, both support and confidence are important. Consider this alternate example of an area where fish is not very popular due to high levels of mercury. Maybe only 5 percent of the transactions involve fish. The item “fish” does not have enough support and hence the rule “fish implies lemons” will not make any significant difference to our sales.
Figure 16.1 shows a typical output of mining analysis using association rules, as analyzed using a tool such as Oracle Discoverer. The first two rules say people often buy WINE or LEMONS to go with FISH.

Figure 16.1. Association Rules
The algorithm used by Oracle Data Mining for association rules is called apriori. The user provides the minimum support and confidence desired. The algorithm first finds single items that occur frequently and have the minimum support—for example, fish. It then finds pairs of items that have the minimum support, such that at least one item in the pair was frequently occurring—for example, fish and lemons. It repeats the process to come up with increasingly larger combinations of items until it can find no more. Once it has found all “frequent item-sets,” it then finds those that satisfy the minimum confidence requirement from the user. These are reported as association rules. Oracle Database 10g has a SQL-based implementation of this algorithm.
16.2.2 Clustering
Clustering is a technique used to divide a large data set with many attributes into a small number of “closely packed” groups. Such groups are not easily apparent to a human eye due to the large number of attributes involved. For example, suppose you had census data for a population, including several attributes, such as age, occupation, occurrence of diseases, and so on. By clustering this data, may find that there are several pockets where a certain disease is prevalent, possibly pointing to a polluted water supply in those regions. Since we have no definite idea of what we may find, this is another example of unsupervised learning.
The groups generated by a good clustering algorithm are such that all items in one group are quite like each other in some respects and very much unlike items in other groups.
Figure 16.2 illustrates the concept of clusters in data. In this figure, two attributes of the data have been plotted using a scatter plot to highlight the clusters. For all items in each cluster, the values of the two attributes have greater similarity compared with items in different clusters. This is an example where the clusters in the data were apparent by simply plotting a graph. In practice, it is not often possible to visualize clusters in this way, since we may have more than two or three dimensions! For instance, in bioinformatics applications, you can have thousands of dimensions! In these situations, we use mathematical clustering algorithms to identify clusters.

Figure 16.2. Clustering
One of the applications where clustering is used is market segmentation. Suppose you were a large retailer selling a wide range of products from soaps to jukeboxes. With clustering, you can segment your customer base into groups based on demographics or past buying habits. This allows you to customize your advertising strategy for each segment and to better serve the more profitable segments.
Clustering is performed by first analyzing a small section of the data to determine clusters. Once the clusters have been determined, the remaining data is then analyzed to assign each individual item to a cluster, with a certain probability.
Clustering Algorithms
Oracle data mining supports two algorithms for clustering:
- ▪
-
Enhanced k-means
- ▪
-
O-Cluster
The k-means algorithm is a clustering algorithm that groups data into a specified number of k clusters. It groups items into clusters based on their relative “distance” from each other. So, all points in one cluster are “closer” to each other than to points in other clusters. The Enhanced k-means algorithm is a variation on the k-means algorithm that forms clusters in a hierarchical fashion. It starts with all the data being in one cluster and then successively splits it into smaller clusters until the desired number of clusters is obtained. It is very efficient compared with traditional k-means, since it only requires one pass through the data and hence can handle large data sets. It works well even for data sets with less than 10 attributes. The metric “distance” used by k-means can only be defined for numerical attributes; hence, if you have discrete values (e.g., color = red, black, blue), then k-means cannot be used.
The O-Cluster algorithm defines clusters using ranges of attribute values. The user does not need to provide the number of clusters to generate. This algorithm can be used for nonnumeric attributes that have a discrete set of values.
16.2.3 Feature Extraction
Feature extraction is a process that identifies important features or attributes of the data. Some examples of this technique are pattern recognition and identifying common themes among a large collection of documents. If the data has a lot of dimensions (such as keywords in a document), then feature extraction can be used to produce a more concise description of the data.
One example of feature extraction that all of us can relate to is spam-detection software. If we had a large collection of emails and the keywords contained in these emails, then a feature extraction process could find correlations among the various keywords. For example, the words Bush and election may appear to be correlated. Thus, the set of emails can now be described using a far smaller number of word phrases than what we started out with. For example, you can tell whether the email is a current news item about the U.S. presidential election or is selling you an unsolicited mortgage product or a new diet solution. Once we have done this, we can then associate certain combinations of words or phrases as spam and automatically out filter these emails. Of course, this is a very oversimplified description of any actual algorithm, but hopefully it has helped you understand the concept of feature extraction.
Feature extraction can be useful to reduce the number of attributes that describe the data. This can speed up data mining using supervised learning techniques such as classification, which we will discuss shortly.
Oracle Data Mining uses various techniques for feature extraction, such as Nonnegative Matrix Factorization (NMF). The details of this technique are beyond the scope of this book.
16.2.4 Classification
Suppose you wanted to target a promotion for a new digital camera and would like to know which of your customers are likely to buy the camera. Classification is a data mining technique that is useful for this application. Classification divides data into two or more well-defined classes. Unlike clustering, where you do not know which groups will be generated, in classification you know exactly what each group represents. In the previous example, the two groups are: customers who are likely to buy a camera and customers who are not likely to buy a camera. This is an example of supervised learning.
In classification, you first analyze a small part of your data to build a model. For instance, you would analyze real data for people who have bought digital cameras and people who have not bought digital cameras, over a given time period. The data used to build a model is known as build data. The model will be built taking into account various factors, such as age, income, and occupation, that are known to influence people’s buying habits. These factors are known as predictor attributes. The output that is predicted is called the target attribute and its values (whether the person will buy the camera or not) are known as categories or classes. Once the model has been generated, it can be applied to other data to come up with a prediction. This is known as model apply, or scoring. In our example, you would use the model to predict whether a certain customer is likely to buy a digital camera.
In the previous example, the target attribute has two values: will buy a digital camera and will not buy a digital camera. You can also use classification to predict attributes with more than two values—for example, whether the risk of a person defaulting on a payment is low, medium or high.
Classification is often used to create customer profiles. For instance, once you have determined which of your customers are likely to buy a digital camera, you can then profile them by occupation, as shown in Figure 16.3. From this graph, you now know that most likely buyers are either engineers or executives. So you can now target your promotions more accurately toward these customers and reduce your costs.

Figure 16.3. Classification
In order for classification to work well, the build data must contain enough samples for each target category; otherwise, it may not be accurate. In other words, your build data must include enough people who have bought digital cameras in the past and enough who have not.
Testing a Classification Model
Data mining using classification usually involves a testing phase to check how good the model is. For this, data where the outcome is known is tested to see how well the model’s predictions match it. For instance, you would take data for customers who have bought a digital camera in the past and check it against the predictions given by the model.
Testing a model involves computation of a structure known as the confusion matrix. A confusion matrix tells you how many times the model’s prediction matched the actual data and how many times it did not. The columns correspond to the predicted values and the rows to the actual values. For instance, in Figure 16.4, the model was correct 555 + 45 = 600 times and wrong 12 + 8 = 20 times. This shows that this model is a pretty good one.

Figure 16.4. Confusion Matrix
Computing Lift
Another metric used to determine the effectiveness of a model is its lift. To understand what lift means, consider the following example. Suppose we have a customer base of 100,000 households and on an average about 2.5 percent (2,500 customers) respond to any given promotion. We would like to get smarter and only target those customers who are most likely to respond. With a good classification model, we should be able to identify most of the likely 2,500 respondents by targeting much fewer than the 100,000 households. Given a certain percentage of target customers, lift is the ratio of the number of respondents obtained with the model against the number obtained without the model.
Lift is computed as follows. The classification model is applied to an actual customer data set, where we know who responded to a past promotion and who did not. The customers are then sorted by their likelihood to respond as predicted by the model, with the most likely respondents first. This sorted list is then divided into 10 equal groups known as deciles. For each decile, the number of customers in the data set who had actually responded to the promotion is counted. If the model is any good, then most of the respondents should come from the top few deciles, since they were predicted to be the most likely respondents.
If you draw a graph with deciles 1 through 10 on the X-axis and the number of actual respondents on the Y-axis, you will typically get the curve shown in Figure 16.5. This curve tells you that you only need to target the customers in the first three deciles (30 percent households), to get 70 percent of those likely to respond. On the other hand, the straight line in this figure corresponds to a random promotion where everyone is predicted to be equally likely to respond. Without the model to guide you, if you target 30 percent households, you will only get 30 percent of the likely respondents. To get 70 percent of the likely respondents, you will have to target 70 percent of the households! The higher the curved line is from the straight line for the first one or two deciles, the better the model’s lift.

Figure 16.5. Using lift analysis for targeted promotions
Confusion matrix and lift are both widely employed techniques to determine the accuracy of classification models. Oracle Data Mining provides APIs that will allow you compute these quantities.
Classification Algorithms
Oracle offers three algorithms for classification:
- ▪
-
Naive Bayes Algorithm
- ▪
-
Adaptive Bayes Network Algorithm
- ▪
-
Support Vector Machines
The Naive Bayes (NB) Algorithm is based on the probability theorem known as Bayes theorem and assumes that each attribute is independent from the other. An interesting property of the NB algorithm is that you can build and cross-validate the model using the same data. This algorithm works best with a small number of predictor attributes (less than 200).
The Adaptive Bayes Network (ABN) Algorithm in its most intuitive form (known as single feature build) produces a model in the form of a decision tree, shown in Figure 16.6. From this decision tree you can see that men between the ages of 15 and 35 and women over 26 are likely to buy a camera. Since the model produced by ABN is in a human-readable form, a business analyst or executive would be more comfortable when using it to make a business decision. The ABN algorithm is usually more accurate than NB, but it takes longer to build the model.

Figure 16.6. Adaptive Bayes Network Decision Tree
Oracle also provides two other modes for the Adaptive Bayes Network model called Pruned Naive Bayes and Boosted, which conceptually allow you to describe the data using multiple decision trees; however, these modes do not provide human-readable rules.
Support Vector Machines (SVM) are a technique for classification based on machine-learning (artificial intelligence) theory. In this technique, mathematical functions called kernels are used to transform data, which makes it possible for the data to be more clearly differentiated into different categories. This is a predictive technique, because the machine (algorithm) is first trained using some initial training data and then learns to correctly classify new data. SVM is used in many real-world applications, such as handwriting recognition and classifying images.
16.2.5 Regression
Regression is a predictive modeling technique, which allows you to describe the relationship between two variables using a line or curve. If the value of one variable (called the independent variable) is known, the line or curve can then be used to predict the value of the other variable (called the dependent variable). The most common technique is linear regression, where you find a straight line that fits the data. In Chapter 6, we saw some built-in SQL functions for linear regression analysis. For example, linear regression may be used to determine if the price of a quantity has any relationship to its total sales.
It is important to note the difference between classification and regression: Classification allows you to classify data when the target attribute is discrete, whereas regression allows you to classify data where the target attribute is continuous or numerical.
The Support Vector Machine technique used for classification can also be used to create regression models for the data.
16.2.6 The PMML Standard
The Predictive Modeling Markup Language (PMML) is an emerging XML-based standard to define data mining models. PMML provides a vendor-independent method of defining models so that the models can be exchanged between different applications. Thus, one application may produce a model and another may apply the model to a data set. Oracle Data Mining supports import and export of Association Rules and Naive Bayes models.
Read full chapter
URL:
https://www.sciencedirect.com/science/article/pii/B9781555583224500187
Profile-guided development with OpenACC
Jeff Larkin, in Parallel Programming with OpenACC, 2017
Summary
OpenACC is a descriptive model for parallel programming and in this chapter we used several OpenACC features to describe the parallelism and data use of a benchmark application and then optimized it for a particular platform. Although the Portland Group compiler and PGProf profiler were used in this chapter, the same process could be applied to any application using a variety of OpenACC-aware tools.
- 1.
-
Obtain a profile of the application to identify unexploited parallelism in the code.
- 2.
-
Incrementally describe the available parallelism to the compiler. When performing this step on architectures with distinct host and accelerator memories, it is common for the code to slow down during this step.
- 3.
-
Describe the data motion of the application. Compilers must always be cautious with data movement to ensure correctness, but developers are able to see the bigger picture and understand how data is shared between OpenACC regions in different functions. After describing the data and data motion to the compiler, performance will improve significantly on architectures with distinct memories.
- 4.
-
Finally, use your knowledge of the application and target architecture to optimize the loops. Frequently loop optimizations will provide only small performance gains, but it is sometimes possible to give the compiler more information about the loop than it would see otherwise to obtain even larger performance gains.
Fig. 32 shows the final performance at each step in terms of speed-up over the original serial code. Notice that the final code achieves a 4× speed-up over the original, serial code, and the multicore version achieves nearly 2.5×. Although the code did slow down at times during the process, it is easy to see why particular steps resulted in a slowdown and make corrections to further improve performance. The final result of this process is a code that has can be run on a variety of parallel architectures and has been tuned for one in particular, without negatively affecting the performance of others. This is OpenACC programming in a nutshell, providing the compiler with sufficient information to run effectively on any modern machine.

Fig. 32. Final performance results for each step.
Read full chapter
URL:
https://www.sciencedirect.com/science/article/pii/B9780124103979000020
Motor Behavior Models for Human-Computer Interaction
I. Scott MacKenzie, in HCI Models, Theories, and Frameworks, 2003
Model for Mapping Degrees of Freedom to Dimensions
One final example of a descriptive model will be given. A topic of great interest in HCI is interactive graphics. The vocabulary of such systems includes terms like dimensions and degrees of freedom. These terms are often used interchangeably; however, the terms are different, and the distinction between them is often poorly articulated. Before proceeding, Figure 3.3 is necessary to establish some terminology.

FIGURE 3.3. A mousepad is a two-dimensional surface with three degrees of freedom: X, Y, and θZ.
The figure shows a mousepad and identifies the most common labels for the axes of motion. Left-to-right motion is translational, along the X axis; to-and-fro motion is translational along the Y axis. If the mouse is rotated on the pad, motion is rotational about the Z axis, labeled θZhai & MacKenzie, 1998), this is not quite true. Here’s where we see a slight point of confusion between dimensions (D) and degrees of freedom (DOF). A true 2D device has three degrees of freedom (3-DOF), as illustrated in Figure 3.3. If a mouse were a true 2D device, then translational motion along the X and Y axes would be sensed, as well as rotational motion about the Z axis. Of course, rotational motion of the mouse is not sensed. This deficiency is illustrated in Figure 3.4. The left two columns show our descriptive model for mapping degrees of freedom to dimensions, using the terminology in Figure 3.3. The third column shows the mappings implemented for a conventional mouse.

FIGURE 3.4. Mapping degrees of freedom to dimensions (see text for discussion).
The model in Figure 3.4 is a simple tool for illustrating the mappings of degrees of freedom to dimensions for real or hypothetical input devices. The apparent shortcoming of the standard mouse as a 2D input device motivated us to design a new mouse to implement the missing DOF. As shown in the fourth column in Figure 3.4, our two-ball mouse also senses rotational motion about the Z axis. An object acquired in a graphics application with this mouse can be positioned in a single gesture both translationally along the X and Y axis and rotationally about the Z axis, thus negating the need for a “rotate tool.” See MacKenzie, Soukoreff, and Pal (1997) for details.
Figure 3.4 also shows the mappings of degrees of freedom to dimensions for other pointing devices. Column A identifies devices that sense only translation along the three axes. An example is the Owl by Pegasus Technologies, Ltd. (Tel Aviv, Israel). Column B identifies true 3D input devices, such as trackers used in virtual reality systems. Such devices sense X-, Y-, and Z-axis translation and rotation. An example is the Isotrak II by Polhemus, Inc. (Colchester, VT). Column C identifies an interesting research prototype known as the Rockin’Mouse. It looks and feels like a mouse, but it has a curved bottom and senses both translation and rotation about the X and Y axes (see Balakrishnan, Baudel, Kurtenbach, & Fitzmaurice, 1997, for details). Column D identifies a hypothetical 5-DOF input device. Because it does not sense Z-axis translation, the device is operated on the mousepad and therefore has that special mouselike appeal.
Read full chapter
URL:
https://www.sciencedirect.com/science/article/pii/B9781558608085500034
Описательная модель
Cтраница 3
Описательные модели предназначены для статистической обработки экспериментальных данных и могут не соответствовать механизму процесса, который эти экспериментальные данные порождает. Сильная сторона описательных моделей в том и заключается, что их можно использовать для управления процессом, не зная физической сути самого процесса. Однако, поскольку эти модели не дают представления о внутреннем механизме изучаемого явления, то, как правило, они верны лишь в тех пределах, в которых получены экспериментальные данные.
[31]
Когда эти попытки не приводят к успеху, генерируется сигнал об ошибке. ПРОФЕССИОНАЛЬНАЯ ХАРАКТЕРИСТИКА — описательная модель профессии ( специальности), определяющая ее место в народном хозяйстве, содержание трудовой деятельности, требования к профессиональной подготовке и контингенту обучаемых.
[32]
Возможны и другие пути решения поставленной задачи. Так, на основе общей описательной модели явления ( 3) можно, не составляя математической модели ( 5), на базе анализа размерностей физических величин, участвующих в процессе ( 9), непосредственно исследовать интересующие явления на моделях физической ( / /) или натурной ( 12), под которыми понимаются некоторые промежуточные объекты для изучения действительности.
[33]
В ряде разделов экономической теории реализован такой подход. Теория жестких систем позволяет получить хорошие описательные модели Вселенной.
[34]
В процессе развития на уровне этой фазы теория формируется в виде некоторой описательной модели обобщенного реального учебного процесса в составе его статического и динамического выражения. Такая схематизированная модель отражает реальные факты, педагогические действия, роль методов и средств по отношению к учебному процессу в целом и в решении частных задач.
[35]
Такой подход к процессу капиталовложений, носящий предписательный характер, можеть быть отнесен к проявлению нормативной экономической теории ( normative economics), где инвесторам даются рекомендации, как и что делать. Настоящая глава посвящена той области позитивной экономической теории ( positive economics), где представлена описательная модель формирования цен. Помимо всего прочего, в этой модели предполагается, что все инвесторы при размещении своих капиталов используют метод, описанный в гл. Наиболее важная черта этой модели заключается в том, что ожидаемая доходность актива увязывается со степенью рискованности этого актива, измеряемой коэффициентом, называемым бета. Точный характер этой зависимости показан в модели оценки финансовых активов ( Capital Asset Pricing Model, САРМ), которая служит теоретической основой ряда различных методов, применяемых в инвестиционной практике.
[36]
Такой подход к процессу капиталовложений, носящий предписательный характер, можеть быть отнесен к проявлению нормативной экономической теории ( normative economics), где инвесторам даются рекомендации, как и что делать. Настоящая глава посвящена той области позитивной экономической теории ( positive economics), где представлена описательная модель формирования цен. Помимо всего прочего, в этой модели предполагается, что все инвесторы при размещении своих капиталов используют метод, описанный в гл. Наиболее важная черта этой модели заключается в том, что ожидаемая доходность актива увязывается со степенью рискованности этого актива, измеряемой коэффициентом, называемым бета. Точный характер этой зависимости показан в модели оценки финансовых активов ( Capital Asset Pricing Model, САРМ), которая служит теоретической основой ряда различных методов, применяемых в инвестиционной практике.
[37]
Критерий принятия решений — функция, выражающая предпочтение лица, принимающего решения, и определяющая правило, по которому выбирается приемлемый или оптимальный вариант решения. Варианты решений возникают в результате анализа проблемной ситуации, представленной в виде описательной модели. В классическом случае описание ситуации дается в виде матрицы, строки которой соответствуют вариантам решений, а столбцы — факторам, которые могут повлиять на результат. На пересечении столбцов и строк расположены соответствующие реализации решений.
[38]
Для того чтобы перейти далее к количественным исследованиям, необходимо прежде всего составить общую описательную модель явления. Причем в эту модель войдут только определенным образом отобранные, существенные для данной задачи процессы. При этом отборе делаются допущения и принимаются некоторые стилизации действительного описания. Общая описательная модель явления ( 3) может быть составлена как описание чисто словесное ( вербальное), например модель строения вещества древнегреческого ученого Демокрита — основателя атомистики.
[39]
Критерий принятия решений — это функция, выражающая предпочтения лица, принимающего решения, и определяющая правило, по которому выбирается приемлемый или оптимальный вариант решения. Задача принятия решений возникает тогда, когда возникает несколько конкурирующих вариантов решения. В противном случае ситуация предопределена. Варианты решений возникают в результате анализа проблемной ситуации, представленной в виде описательной модели.
[40]
Мы можем резюмировать сказанное выше, заметив, что все эти применения моделей образуют дихотомию. Иными словами, модель может служить для достижения одной из двух основных целей: либо описательной, если модель служит для объяснения и ( или) лучшего понимания объекта, либо предписывающей, когда модель позволяет предсказать и ( или) воспроизвести характеристики объекта, определяющие его поведение. Модель предписывающего типа обычно является и описательной, но не наоборот. Это означает, что предписывающая модель почти всегда является описательной по отношению к моделируемому объекту, но описательная модель не всегда полезна для целей планирования и проектирования. Вероятно, в этом кроется одна из причин, почему экономические модели ( в которых обнаруживается тенденция к описательности) оказали небольшое воздействие на управление экономическими системами и мало применялись в качестве вспомогательного средства управления на высшем уровне, в то время как модели исследования операций, по общему признанию, оказали значительное воздействие на эти сферы.
[41]
Третья сложность, с которой сталкивались многие, пытаясь разобраться в правилах принятия решений, является результатом того, что опускается одна из ступеней последовательного абстрагирования, связанного с процессом принятия решений. Ранее мы исходили из предположения, что действия на низшем уровне процесса принятия решений являются случайными и иррациональными. Для второго уровня характерны разумные и рациональные действия, однако здесь еще не ясно, какие руководящие правила лежат в основе этих действий. На третьем уровне, с тех пор как существует писаная история, человек уже имеет по крайней мере словесную описательную модель рациональных правил, создающих поток индивидуальных решений.
[42]
Объяснительные модели призваны ответить на вопрос, почему что-либо происходит. Прогностические модели должны описывать будущее поведение объекта, т.е. отвечать на вопрос, к каким изменениям приводит то или иное воздействие на исследуемый объект. Заметим, что прогностические модели совсем не обязаны включать в себя объяснительные модели. Нередко удается получить удовлетворительный прогноз на основе эмпирических обобщений, т.е. используя только данные описательной модели.
[43]
Наиболее часто отсутствует получатель документов. Это объясняется тем, что документы, не имеющие в своем составе указания, кому они представляются, направляют с сопроводительным письмом. Приведенные обобщающие реквизиты заголовочной части, как правило, кодируются и вводятся в ЭВМ, поэтому их различная последовательность расположения вызовет затруднения при обработке, о чем мы уже говорили выше. Резко различается также число реквизитов, которые предусмотрены формулярами-образцами. Некоторая специфика в оформлении документов различных систем имеется, но она не оправдывает столь широкого разнообразия. Количество зон, установленных утвержденными ранее стандартами, больше, чем у группы стандартов, введенных в 1976 г. Следовательно, последние стандарты менее формализованы, особенно если учесть, что отдельные из них имеют все границы зон подвижными, приближая формуляр-образец ( графическую модель) к менее конкретной описательной модели построения документов.
[44]
Страницы:
1
2
3
По мере развития человечества происходит структуризация и оптимизация наличных у нас данных и возможностей их использования. При этом ключевой является информационная модель. На сегодняшний день она является существенно недооценённым инструментов планирования. Чтобы сломать эту тенденцию, необходимо рассказывать аудитории о её возможностях, чем и займётся автор этой статьи.
Что называют информационной моделью? Описание и структура
 Так называют модель объекта. Она представлена в виде информации, что описывает существенные для конкретного случая параметры и переменные, связи между ними, а также входы и выходы для данных, при подаче на которые можно влиять на получаемый результат. Их нельзя увидеть или потрогать. В целом они не имеют материального воплощения, поскольку строятся на использовании одной информации. Сюда относятся данные, что характеризуют состояния объекта, существенные свойства, процессы и явления, а также связь с внешней средой. Это процесс называется описанием информационной модели. Это самый первый шаг проработки. Полноценной информационной моделью является обычно сложная разработка, которая может иметь много структур, что в рамках статьи сведены в три основных типа:
- Описательная. Сюда относятся модели, которые создаются на естественных языках. Они могут иметь любую произвольную структуру, которая удовлетворит составляющего их человека.
- Формальная. Сюда относят модели, которые создаются на формальных языках (научных, профессиональных или специализированных). В качестве примеров можно привести такое: все виды таблиц, формул, граф, карт, схемы и прочих подобных структурных формаций.
- Хроматические. Сюда относят модели, которые были созданы с применением естественного языка семантики цветовых концептов, а также их онтологических предикатов. Под последними понимают возможность распознавания значений цветовых канонов и смыслов. В качестве примера хроматических моделей можно навести те, что были построены с использованием соответствующей теоретической базы и методологии.
Как видим, основной составляющей являются данные, их структура и процедура обработки. Развивая мысль, можно дополнить, что информационная модель является схемой, в которой описана суть определённого объекта, а также все необходимые для его исследования процедуры. Для более полного описания характеристик используют переменные. Они замещают атрибут цели, которая прорабатывается. И здесь имеет значительную важность структура информационной модели.
Давайте приведём пример. Описание веника и инструкция по его использованию является информационной моделью для уборщика. Но это не всё. Описание и технологический процесс изготовления веника, изложений в соответствующей документации, является информационной моделью и алгоритмом, по которому его делает производитель. Как видите, отражаются наиболее важные свойства объекта. В действительности, конечно, информационная модель – это лишь приближенное описание. В результате можно сказать, что эти данные, с помощью которых осуществляется познание реальности, являются относительно истинными.
Общая классификация
 Какие информационные модели существуют? Классификация сформирована на основе самого определения:
- Зависимо от количества значений переменных они делятся на динамические и статистические.
- По способу описания бывают знаковыми, натурными, формализованными.
- Зависимо от особенностей конструирования переменных делятся на графовые, графические, идеографические, текстовые, алгоритмические, табличные.
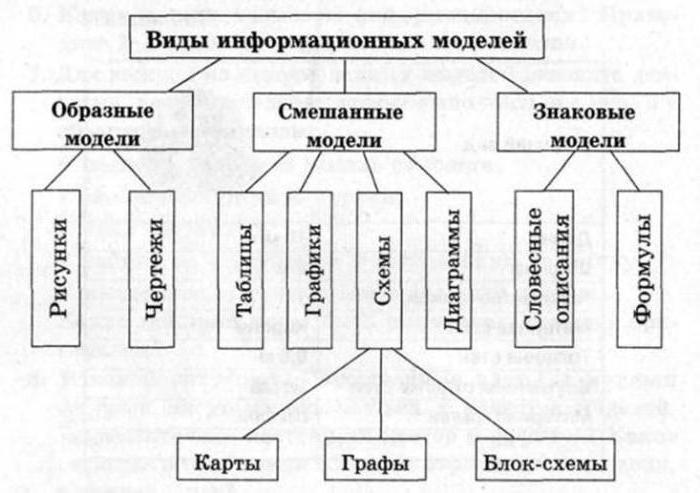
Виды информационных моделей
 Исследованию поддаётся как физический, так и идеальный объект анализа. Это приводит к тому, что существование одинаковых информационных моделей, к которым можно подойти с тем же самых набором инструментариев, нет. Поэтому приходится использовать отдельные подходы и что-то особенное, что позволит изучить или исследовать предметную область. На основании таких суждений принято выделять три виды информационных моделей:
- Математические. Благодаря им изучают явления и процессы, что являются представленными в виде наиболее общих математических закономерностей или абстрактных объектов, которых достаточно, чтобы выразить законы природы или внутренние свойства наблюдаемого. Также применяются для подтверждения правила логических рассуждений.
- Компьютерные. Используется для описания совокупности переменных, что представлены абстрактными типами данных и поданы в соответствии с выдвигаемыми требованиями среды обработки ЭОМ.
- Материальные. Так называют предметное отражение объекта, сохраняющее геометрические и физические свойства (глобус, игрушки, манекены). Также к материальным моделям относят химические опыты.
Типы информационных моделей
Поскольку они являются совокупностью информации, то часто характеризуют состояние и свойства объекта, явления, процесса и их взаимодействие с окружающим их миром. Зависимо от того, как они представлены и выражены, выделяют два типы информационных моделей:
- Вербальные. Они создаются как результат умственной деятельности человека и представляются в словесной форме или при помощи жестикуляции.
- Знаковые. Для их выражения используются рисунки, схемы, графики, формулы.
Что необходимо для их создания?
 Информация, причём как можно более точная. Чем больше предоставленные данные отвечают реальным показателем, тем эффективней применяется модель на практике. Чтобы разработать модель, сначала проводится сбор всей возможной информации. Она отсеивается и остаётся та, что предоставляет наибольшую ценность для исследователя. Проводится анализ предоставляющей интерес информации, на основании которого она структурируется. И зависимо от целей исследователь из отдельных блоков данных строит необходимую модель. Потом проводится поиск ошибок и ликвидация противоречий. Когда этот шаг закончен, то разработка информационной модели тоже считается завершённой.
Где применяются информационные модели?
 Везде. Только такое обозначение не всегда применяется на практике из-за его излишней научности. Инструкции для компьютеров, телевизоров, телефонов, использованных бутылей воды, автомобильных аккумуляторов – вот лишь отдельные примеры. Информационной моделью является и технология производства комбайнов, тракторов, самолётов, грузовиков, прицепов, строений. Как видите, для неё есть применение и в быту, и в промышленности. Но сам термин «информационная модель» больше применяется в последней сфере из-за того, что здесь протекают более сложные процессы с участием большого количества людей.
Пример создания
Давайте попробуем детально проанализировать, что такое информационная модель. Это не так сложно, как может показаться. В качестве примера возьмём клавиатуру. Можно определить два направления относительно пользователя: описание и вопросы настройки. Во-первых, производительно пишет в аннотации, какой это хороший продукт, что он может, как с ним удобно работать. Анализирует передовые технологии, применённые при её создании, экологические преимущества и прочие подобные вещи. Главное – понравиться. Но лгать всё же не надо, поскольку это будет иметь нежелательные последствия.
Во-вторых, прорабатываются вопросы настройки. Можно ответить на них с помощью картинок на листке-вкладыше, где будет изображено, куда вставить разъём клавиатуры в компьютер. Также может прилагаться небольшой ремонтный комплект, инструкция по его использованию, особенности построение устройства, как его следует разбирать в случае возникновения определённых проблем – и ряд других вопросов, которые можно только продумать и дать ответ пользователям на них.
Особенности
 Чем больше данных, тем описание информационной модели будет сложнее. Это две стороны медали: следует выбирать между точностью и функциональностью. Чтобы не перегибать палку или избежать слабой проработки вопроса следует заранее очертить задачи для проработки и глубину их разбора. Следует позаботиться обо всех имеющихся моментах, поскольку любая проблема, допущенная на этом этапе, в будущем только добавит работы и необходимость затраты денежных средств на устранение конфликта.
Изучение аспектов информационного моделирования
 С научной точки зрения этим вопросом занимается кибернетика. Поэтому, если у вас есть желание углубить свои познания в этой области, запаситесь несколькими недавно вышедшими книгами и внимательно изучите их. Хотя можно и по-другому осведомиться, что такое простейшие информационные модели. Информатика может дать необходимый базис, но для получения всей полноты знаний нужна именно кибернетика. В её рамках можно будет ознакомиться не только с детализированными принципами моделирования, но и узнать про существующие разработки, а также возможности их применения.
Заключение
 Информационная модель – это важный и полезный инструмент, если правильно его использоваться. При создании сложных систем (например, программного обеспечения) он позволяет проработать основные технические вопросы и устранить возможные не состыковки. В рамках статьи были размещены знания про то, какие информационные модели есть, как они создаются и другая полезная информация, что пригодится на практике.